Question
Fabricating steel slabs is not a single-week operation, but requires longer-term planning. We want to plan the production for the next T weeks, rather than
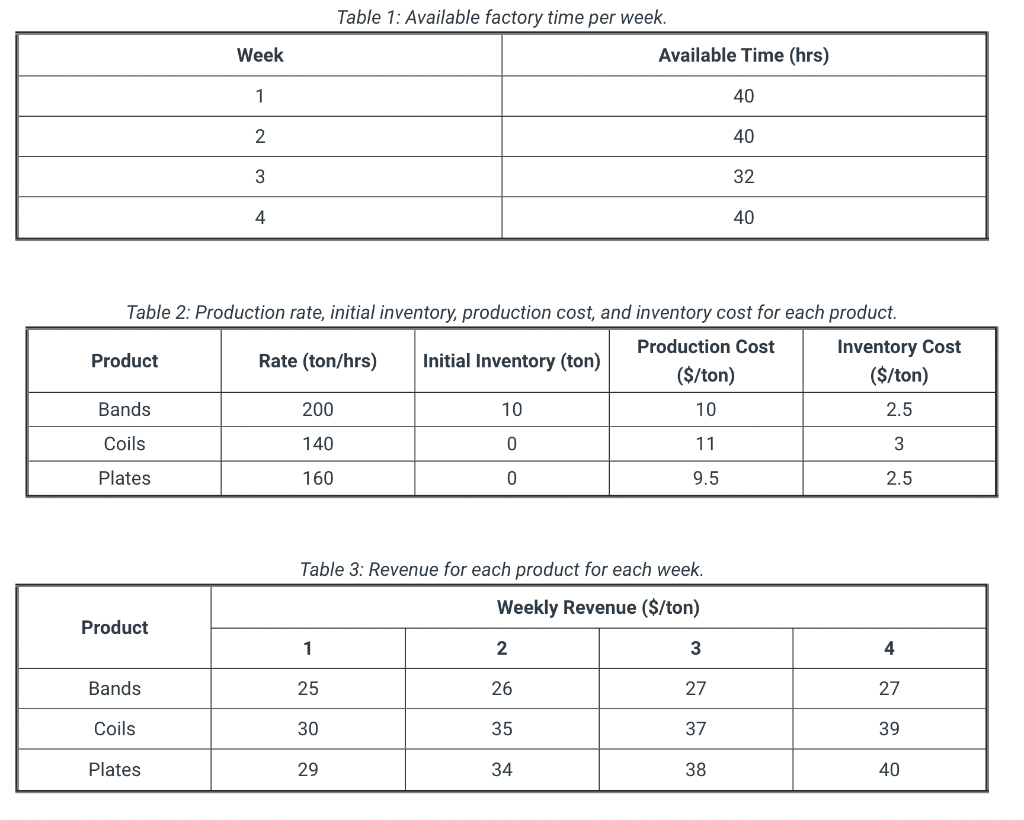
Fabricating steel slabs is not a single-week operation, but requires longer-term planning. We want to plan the production for the next T weeks, rather than for a single week. Assume that you can sell everything you produce. Some of a week's production can be placed in inventory, for sale at any later week. There is an inventory fee per ton per week. The following information is available and organized in various tables: Table 1: Available factory time (hrs) per week Table 2: Production rate (ton/hrs), initial inventory (ton), production cost ($/ton), and inventory cost ($/ton) for each product. Table 3: Revenue ($/ton) for each product for each week. Table 4: Production capacity (ton) for each product for each week. Formulate an optimization problem that can be used to maximize the total profit. Create a new .mod, .dat, and .run file to reflect the changes made to the Steel Production Problem.


Table 1: Available factory time per week. Week Available Time (hrs) 1 40 2 40 3 32 4 40 Table 2: Production rate, initial inventory, production cost, and inventory cost for each product. Production Cost Product Rate (ton/hrs) Initial Inventory (ton) ($/ton) Inventory Cost ($/ton) 2.5 Bands 200 10 10 Coils 140 0 11 3 Plates 160 0 9.5 2.5 Table 3: Revenue for each product for each week. Weekly Revenue ($/ton) Product 1 2 3 4 Bands 25 26 27 27 Coils 30 35 37 39 Plates 29 34 38 40 Product Bands Coils Plates Table 4: Production capacity for each product for each week. Weekly Production Capacity (ton) 1 2 3 6000 6000 4000 4000 2500 3500 3500 3000 4000 4 6500 4200 4500 Table 1: Available factory time per week. Week Available Time (hrs) 1 40 2 40 3 32 4 40 Table 2: Production rate, initial inventory, production cost, and inventory cost for each product. Production Cost Product Rate (ton/hrs) Initial Inventory (ton) ($/ton) Inventory Cost ($/ton) 2.5 Bands 200 10 10 Coils 140 0 11 3 Plates 160 0 9.5 2.5 Table 3: Revenue for each product for each week. Weekly Revenue ($/ton) Product 1 2 3 4 Bands 25 26 27 27 Coils 30 35 37 39 Plates 29 34 38 40 Product Bands Coils Plates Table 4: Production capacity for each product for each week. Weekly Production Capacity (ton) 1 2 3 6000 6000 4000 4000 2500 3500 3500 3000 4000 4 6500 4200 4500
Step by Step Solution
There are 3 Steps involved in it
Step: 1

Get Instant Access to Expert-Tailored Solutions
See step-by-step solutions with expert insights and AI powered tools for academic success
Step: 2

Step: 3

Ace Your Homework with AI
Get the answers you need in no time with our AI-driven, step-by-step assistance
Get Started


