Answered step by step
Verified Expert Solution
Question
1 Approved Answer
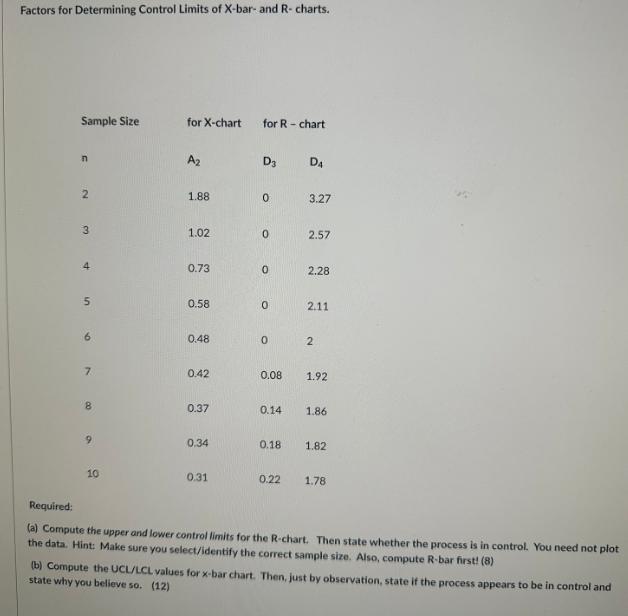
Factors for Determining Control Limits of X-bar- and R- charts. Sample Size n 2 3 4 5 6 7 8 00 a 10 for


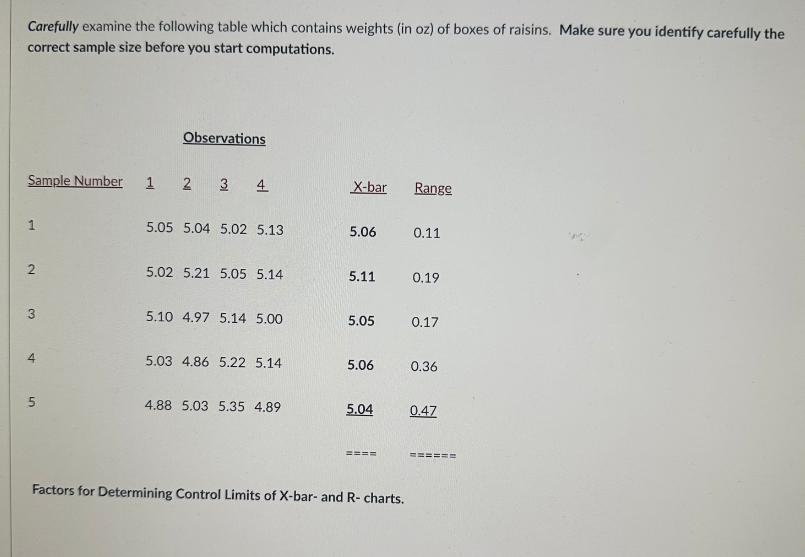
Factors for Determining Control Limits of X-bar- and R- charts. Sample Size n 2 3 4 5 6 7 8 00 a 10 for X-chart for R-chart A 1.88 1.02 0.73 0.58 0.48 0.42 0.37 0.34 0.31 D3 0 0 0 0 0 0.08 0.14 0.18 D 3.27 2.57 2.28 2.11 2 1.92 1.86 1.82 0.22 1.78 Required: (a) Compute the upper and lower control limits for the R-chart. Then state whether the process is in control. You need not plot the data. Hint: Make sure you select/identify the correct sample size. Also, compute R-bar first! (8) (b) Compute the UCL/LCL values for x-bar chart. Then, just by observation, state if the process appears to be in control and state why you believe so. (12) Carefully examine the following table which contains weights (in oz) of boxes of raisins. Make sure you identify carefully the correct sample size before you start computations. Sample Number 1 2 1 2 3 st Observations 5 3 4 5.05 5.04 5.02 5.13 5.02 5.21 5.05 5.14 5.10 4.97 5.14 5.00 5.03 4.86 5.22 5.14 4.88 5.03 5.35 4.89 X-bar 5.06 5.11 5.05 5.06 5.04 ==== Factors for Determining Control Limits of X-bar- and R-charts. Range 0.11 0.19 0.17 0.36 0.47 ======
Step by Step Solution
★★★★★
3.44 Rating (163 Votes )
There are 3 Steps involved in it
Step: 1
Sure Id be happy to help you with the factors for determining control limits of Xbar and Rcharts For ...
Get Instant Access to Expert-Tailored Solutions
See step-by-step solutions with expert insights and AI powered tools for academic success
Step: 2

Step: 3

Ace Your Homework with AI
Get the answers you need in no time with our AI-driven, step-by-step assistance
Get Started


