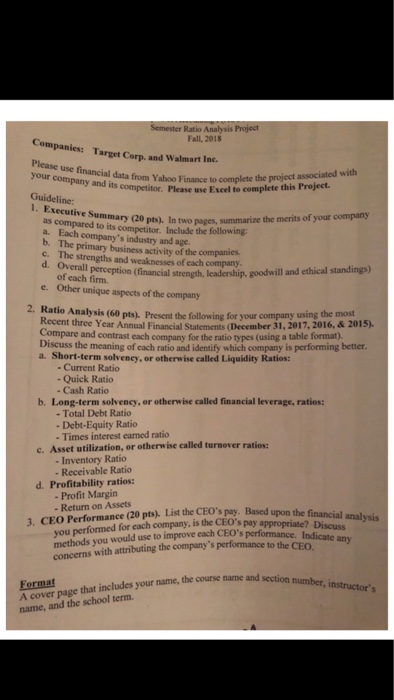
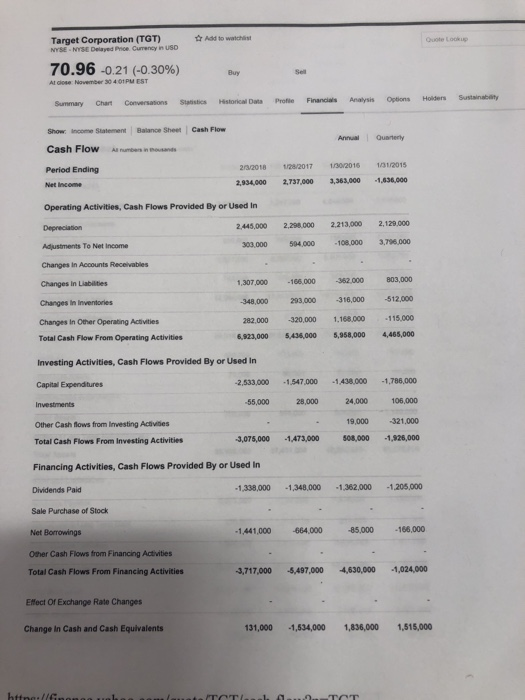
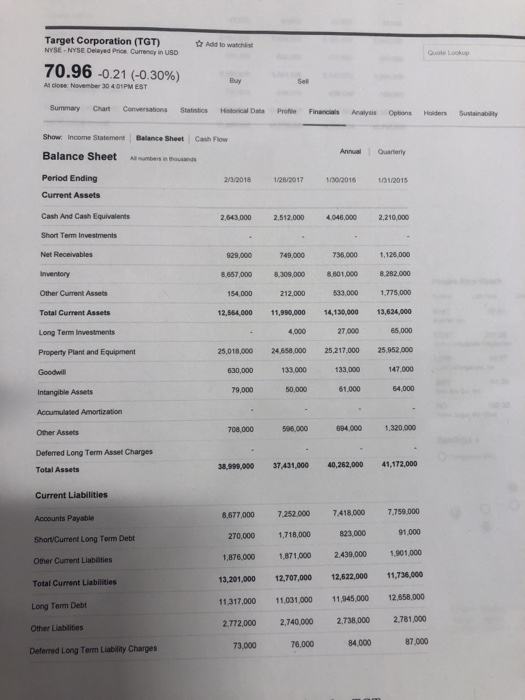
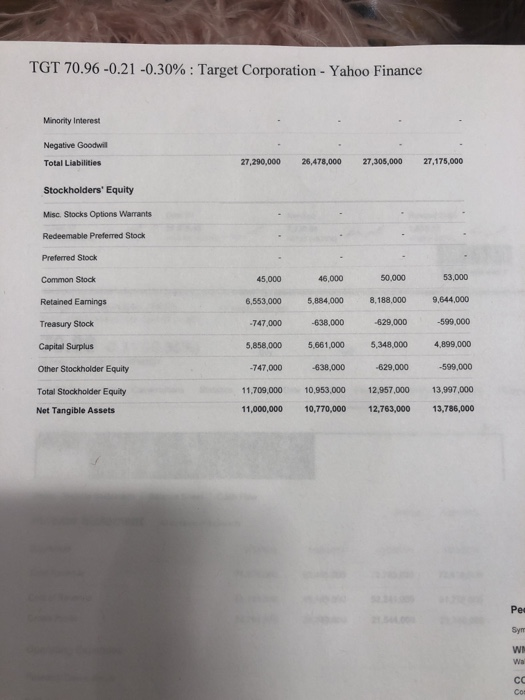
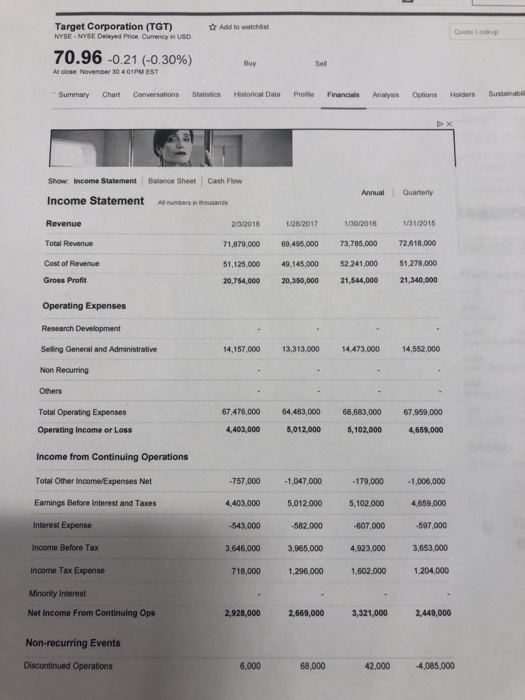
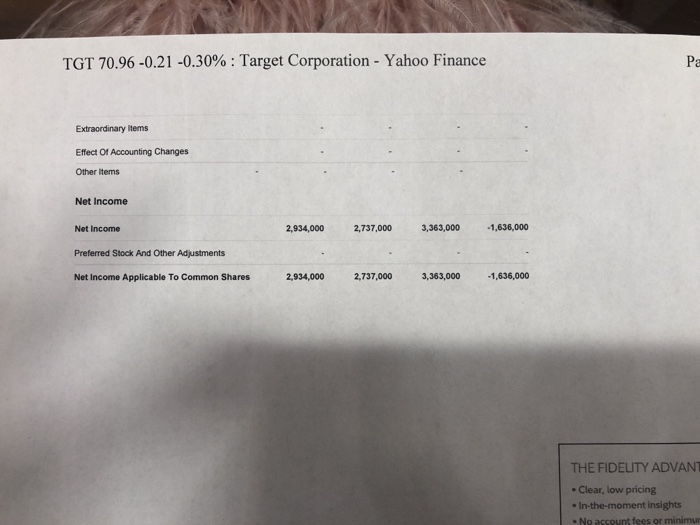
Fall, 2018 Companies: Target Corp. and Walmart lac Please use financial data from Yahoo Finance to e to comptet your company Guideline: 1. Executive Summary (20 pts). In two pages associated with its competitor. Please use Exel to compkete this Project is compared to its competitor. Include the following a. Each company's industry and age. py b. The primary business activity of the companies c. The strengths and weaknesses of each company d. Overall perception (financial strength, leadership, goodwill and ethical standings) of each firm. Other unique aspects of the company e. 2. Ratio Analysis (60 pts). Present the following for your company using the most Recent three Year Annual Financial Statements (December 31, 2017,2016, &2015) Compare and contrast each company for the ratio types (using a table format). scuss the meaning of each ratio and identify which company is performing better a. Short-term solvency, or otherwise called Liquidity Ratios: - Current Ratio - Quick Ratio -Cash Ratio b. Long-term solvency, or otherwise called financial leverage, ratios: - Total Debt Ratio -Debt-Equity Ratio - Times interest earned ratio c. Asset utilization, or otherwise called turnover ratios: - Inventory Ratio Receivable Ratio d. Profitability ratios: Profit Margin - Return on Assets 3. CEO Performance (20 pts). List the CEO's pay. Based upon the financial analysis you performed for each company, is the CEO's pay appropriate? methods you would use to improve each erppropriate? Indicate any with attributing the company's performance to the CEO Format A cover page that includes your name, the course name and section name, and the school term and section number, instructor's Target Corporation (TGT) NYSE-NYSE Delayed Price r Add to atchlst 70.96-0.21 (-0.30%) Buy 0 401PM EST Chart ConversationsStatistics Historical Dats Profte Financials Analysis Options Holders Show: income Statement Balance Sheet Cash Flow Cash Flow umbers in usand Period Ending Net Income Operating Activities, Cash Flows Provided By or Used In Annual Quaterly 2/32018 1/28/2017 1/30/2016 10112015 2,934,000 2,737,000 3,363,000 1,636,000 2445,000 2.298000 2.213,000 2,12,000 303,000504,000 108,000 3,796.000 Adjustments To Net Income Changes in Accounts Receivables Changes in Liabilities Changes in Inventories Changes iIn Other Operating Activities Total Cash Flow From Operating Activities Investing Activities, Cash Flows Provided By or Used In Capital Expenditures ,307,000-166,000362.000 803,000 348,000 293,000 -316,000 512,000 282,000 -320,000 1168000 115,000 6,823,000 5436000 5,958,000 ,465,000 2,533,000 1.547,000 1.438,000 1,786,000 55,00028,000 24,000 106,000 19,000 321,000 3,075,000 1,473,000 08,000 -1,926,000 Other Cash flows from Investing Acivises Total Cash Flows From Investing Activities Financing Activities, Cash Flows Provided By or Used in 1,338,000 1,348,000 1.362.000 1.205,000 Dividends Paid Sale Purchase of Stock Net Borroings Osher Cash Flows from Financing Activities Total Cash Flows From Financing Activities 1,441,000 664.000 85,000 166,000 3,717,000 5,497,000 4,630,000 1,024,000 Effect Of Exchange Rate Changes Change In Cash and Cash Equivalents 131,000 1,534,000 1,836,000 1,515,000 Target Corporation (TGT) NYSE-NYSE Delayed Price Currency in USD Add to watch Quote Lockup 70.96.021 (-0.30%) At close: November 30 4.01PM EST Summary Chart Conversations Statistics Hstorical Data Profle Financials Analysis Options Holiders Sustainability Show. Income Statement Balance Sheet Cash Flow Balance Sheetmbers n houand Period Ending Current Assets Cash And Cash Equivalents Short Term Investments AnnualQuarterly 2/3/2018 1280017 1002016 12015 2,643.000 2,512.000 046,000 2,210,000 740,000 738.000 1128,000 1,126,000 ,657,000 8,309,000 601,000 8.282000 533,000 1,775,000 12,564,000 11,990,000 4,130,000 13,624,000 65,000 929,000 Other Current Assets Total Current Assets Long Term Investments Property Plant and Equipment 154,000 212,000 4,000 27,000 25,018000 24,658.000 25,217000 25.952,000 133,000 147.000 64,000 630,000133,000 Intangible Assets 9,000 50,000 61,000 708,000 5000 694,000 1320,000 Other Assets Deferred Long Term Asset Charges Total Assets 38,999,000 37,431,000 40,262,000 41,172,000 Current Liabilities Accounts Payable ShortvCurrent Long Tem Debt Other Current Liabilities Total Current Liabilities Long Term Debt Other Liabilities 8.677000 7.252.00074180007.759000 91,000 270,000 1,718,000 1,876.000 1871,000 2.439,000 1,901,000 13,201,000 12,707,000 12,622,000 11,736,000 11.317,000 11,031,000 11,45,000 12,658,000 2.772000 2.740,000 2,738,000 2.781,000 823,000 73,000 76,000 84,000 87,000 Deferred Long Term Liability Charges TGT 70.96-0.21-0.30% : Target Corporation-Yahoo Finance Minority Interest Negative Goodwill Total Liabilities 27,290,000 26,478,000 27,305,000 27,175,000 Stockholders' Equity Misc. Stocks Options Warrants Redeemable Preferred Stock Preferred Stock Common Stock Retained Eanings Treasury Stock Capital Surplus Other Stockholder Equity 53,000 6,553,000 5,884,000 8,188,000 9,644,000 -599,000 45,000 46,000 50,000 747,000 638.000 629,000 5,858,000 5,661,000 5,348,000 4,899,000 -747,000 638,000 629,000 -599,000 Total Stockholder Equity 11,709,000 10,953,000 12,957,000 13,997,000 Net Tangible Assets 11,000,000 10,770,000 12,763,000 13,786,000 Pe Syn Wa Target Corporation (TGT) NYSE NYSE Delayed Price Currency in USD Add to watchi Quote Lookup 70.96-0.21 (-0.30%) uy Sel At cose: November 30 4 01PM EST Summary Chart Conversations Statistics Historical Data Profile Financials Anlysis Options Holders Sustainabes Show Income Statement Balance Sheet Cash Flow Income Statementll mbr in thousan Revenue Total Revenue Cost of Revenue Gross Profit Annual Quarterly 232018 1/28/2017 13/2016 1/31/2015 1,879,000 69,495,000 3,785,000 72,618,000 51,125,000 49.145,00052,241,000 1278,000 20,754,000 20,350,000 21,544,000 21,340,000 Operating Expenses Research Development Selling General and Administrative Non Recurring Others 14,157,000 13,313.000 14,473,000 14,552,000 Total Operating Expenses Operating Income or Loss Income from Continuing Operations Total Other Income/Expenses Net Eamings Before Interest and Taxes Interest Expense Income Before Tax 67.476,000 64.483,000 68,683,000 67,959,000 4,403,000 5,012,000 5,102,0004,659,000 179,000 1,006,000 4.403,000 5,012,000 5,102,000 4,659,000 -607.000 597,000 3,646,000 3,965,000 4,923,000 3,653,000 718,000 1,296,000 1,602.000 1,204,000 757,000 1,047,000 543,000 582,000 Income Tax Expense Minority Interest Net Income From Continuing Ops Non-recurring Events Discontinued Operations 2,928,000 2,669,000 3,321,000 2,449,000 6,000 68,000 42,000 4,085,000 TGT 70.96-0.21-0.30% : Target Corporation-Yahoo Finance Pa Extraordinary ltems Effect Of Accounting Changes Other items Net Income Net Income 2,934,000 2,737,000 3,363,000 1,636,000 Preferred Stock And Other Adjustments Net Income Applicable To Common Shares 2,934,000 2,737,000 3,363,000 1,636,000 THE FIDELITY ADVANT . Clear, low pricing In-the-moment insights . No account fees or minimu Fall, 2018 Companies: Target Corp. and Walmart lac Please use financial data from Yahoo Finance to e to comptet your company Guideline: 1. Executive Summary (20 pts). In two pages associated with its competitor. Please use Exel to compkete this Project is compared to its competitor. Include the following a. Each company's industry and age. py b. The primary business activity of the companies c. The strengths and weaknesses of each company d. Overall perception (financial strength, leadership, goodwill and ethical standings) of each firm. Other unique aspects of the company e. 2. Ratio Analysis (60 pts). Present the following for your company using the most Recent three Year Annual Financial Statements (December 31, 2017,2016, &2015) Compare and contrast each company for the ratio types (using a table format). scuss the meaning of each ratio and identify which company is performing better a. Short-term solvency, or otherwise called Liquidity Ratios: - Current Ratio - Quick Ratio -Cash Ratio b. Long-term solvency, or otherwise called financial leverage, ratios: - Total Debt Ratio -Debt-Equity Ratio - Times interest earned ratio c. Asset utilization, or otherwise called turnover ratios: - Inventory Ratio Receivable Ratio d. Profitability ratios: Profit Margin - Return on Assets 3. CEO Performance (20 pts). List the CEO's pay. Based upon the financial analysis you performed for each company, is the CEO's pay appropriate? methods you would use to improve each erppropriate? Indicate any with attributing the company's performance to the CEO Format A cover page that includes your name, the course name and section name, and the school term and section number, instructor's Target Corporation (TGT) NYSE-NYSE Delayed Price r Add to atchlst 70.96-0.21 (-0.30%) Buy 0 401PM EST Chart ConversationsStatistics Historical Dats Profte Financials Analysis Options Holders Show: income Statement Balance Sheet Cash Flow Cash Flow umbers in usand Period Ending Net Income Operating Activities, Cash Flows Provided By or Used In Annual Quaterly 2/32018 1/28/2017 1/30/2016 10112015 2,934,000 2,737,000 3,363,000 1,636,000 2445,000 2.298000 2.213,000 2,12,000 303,000504,000 108,000 3,796.000 Adjustments To Net Income Changes in Accounts Receivables Changes in Liabilities Changes in Inventories Changes iIn Other Operating Activities Total Cash Flow From Operating Activities Investing Activities, Cash Flows Provided By or Used In Capital Expenditures ,307,000-166,000362.000 803,000 348,000 293,000 -316,000 512,000 282,000 -320,000 1168000 115,000 6,823,000 5436000 5,958,000 ,465,000 2,533,000 1.547,000 1.438,000 1,786,000 55,00028,000 24,000 106,000 19,000 321,000 3,075,000 1,473,000 08,000 -1,926,000 Other Cash flows from Investing Acivises Total Cash Flows From Investing Activities Financing Activities, Cash Flows Provided By or Used in 1,338,000 1,348,000 1.362.000 1.205,000 Dividends Paid Sale Purchase of Stock Net Borroings Osher Cash Flows from Financing Activities Total Cash Flows From Financing Activities 1,441,000 664.000 85,000 166,000 3,717,000 5,497,000 4,630,000 1,024,000 Effect Of Exchange Rate Changes Change In Cash and Cash Equivalents 131,000 1,534,000 1,836,000 1,515,000 Target Corporation (TGT) NYSE-NYSE Delayed Price Currency in USD Add to watch Quote Lockup 70.96.021 (-0.30%) At close: November 30 4.01PM EST Summary Chart Conversations Statistics Hstorical Data Profle Financials Analysis Options Holiders Sustainability Show. Income Statement Balance Sheet Cash Flow Balance Sheetmbers n houand Period Ending Current Assets Cash And Cash Equivalents Short Term Investments AnnualQuarterly 2/3/2018 1280017 1002016 12015 2,643.000 2,512.000 046,000 2,210,000 740,000 738.000 1128,000 1,126,000 ,657,000 8,309,000 601,000 8.282000 533,000 1,775,000 12,564,000 11,990,000 4,130,000 13,624,000 65,000 929,000 Other Current Assets Total Current Assets Long Term Investments Property Plant and Equipment 154,000 212,000 4,000 27,000 25,018000 24,658.000 25,217000 25.952,000 133,000 147.000 64,000 630,000133,000 Intangible Assets 9,000 50,000 61,000 708,000 5000 694,000 1320,000 Other Assets Deferred Long Term Asset Charges Total Assets 38,999,000 37,431,000 40,262,000 41,172,000 Current Liabilities Accounts Payable ShortvCurrent Long Tem Debt Other Current Liabilities Total Current Liabilities Long Term Debt Other Liabilities 8.677000 7.252.00074180007.759000 91,000 270,000 1,718,000 1,876.000 1871,000 2.439,000 1,901,000 13,201,000 12,707,000 12,622,000 11,736,000 11.317,000 11,031,000 11,45,000 12,658,000 2.772000 2.740,000 2,738,000 2.781,000 823,000 73,000 76,000 84,000 87,000 Deferred Long Term Liability Charges TGT 70.96-0.21-0.30% : Target Corporation-Yahoo Finance Minority Interest Negative Goodwill Total Liabilities 27,290,000 26,478,000 27,305,000 27,175,000 Stockholders' Equity Misc. Stocks Options Warrants Redeemable Preferred Stock Preferred Stock Common Stock Retained Eanings Treasury Stock Capital Surplus Other Stockholder Equity 53,000 6,553,000 5,884,000 8,188,000 9,644,000 -599,000 45,000 46,000 50,000 747,000 638.000 629,000 5,858,000 5,661,000 5,348,000 4,899,000 -747,000 638,000 629,000 -599,000 Total Stockholder Equity 11,709,000 10,953,000 12,957,000 13,997,000 Net Tangible Assets 11,000,000 10,770,000 12,763,000 13,786,000 Pe Syn Wa Target Corporation (TGT) NYSE NYSE Delayed Price Currency in USD Add to watchi Quote Lookup 70.96-0.21 (-0.30%) uy Sel At cose: November 30 4 01PM EST Summary Chart Conversations Statistics Historical Data Profile Financials Anlysis Options Holders Sustainabes Show Income Statement Balance Sheet Cash Flow Income Statementll mbr in thousan Revenue Total Revenue Cost of Revenue Gross Profit Annual Quarterly 232018 1/28/2017 13/2016 1/31/2015 1,879,000 69,495,000 3,785,000 72,618,000 51,125,000 49.145,00052,241,000 1278,000 20,754,000 20,350,000 21,544,000 21,340,000 Operating Expenses Research Development Selling General and Administrative Non Recurring Others 14,157,000 13,313.000 14,473,000 14,552,000 Total Operating Expenses Operating Income or Loss Income from Continuing Operations Total Other Income/Expenses Net Eamings Before Interest and Taxes Interest Expense Income Before Tax 67.476,000 64.483,000 68,683,000 67,959,000 4,403,000 5,012,000 5,102,0004,659,000 179,000 1,006,000 4.403,000 5,012,000 5,102,000 4,659,000 -607.000 597,000 3,646,000 3,965,000 4,923,000 3,653,000 718,000 1,296,000 1,602.000 1,204,000 757,000 1,047,000 543,000 582,000 Income Tax Expense Minority Interest Net Income From Continuing Ops Non-recurring Events Discontinued Operations 2,928,000 2,669,000 3,321,000 2,449,000 6,000 68,000 42,000 4,085,000 TGT 70.96-0.21-0.30% : Target Corporation-Yahoo Finance Pa Extraordinary ltems Effect Of Accounting Changes Other items Net Income Net Income 2,934,000 2,737,000 3,363,000 1,636,000 Preferred Stock And Other Adjustments Net Income Applicable To Common Shares 2,934,000 2,737,000 3,363,000 1,636,000 THE FIDELITY ADVANT . Clear, low pricing In-the-moment insights . No account fees or minimu