- Fanancial Analytics FIN310
Go to the Atom Finance (Links to an external site.) website and select a company of your choice to evaluate. Using the financial data tab, transfer the information from the income statement for at least two years to a new Excel workbook. Use the exhibit 5-2 from your text as an example. Calculate the Percent of Sales Forecast for the subsequent year in column B of your spreadsheet.
- Submit the spreadsheet.
- Submit a 1-2-page summary of your findings. Include the definition and purpose of using the percent of sales forecasting method. Also include ideas regarding other important statistical calculations or forecasts that would help with decision making.
*** I have included the data for Peloton.
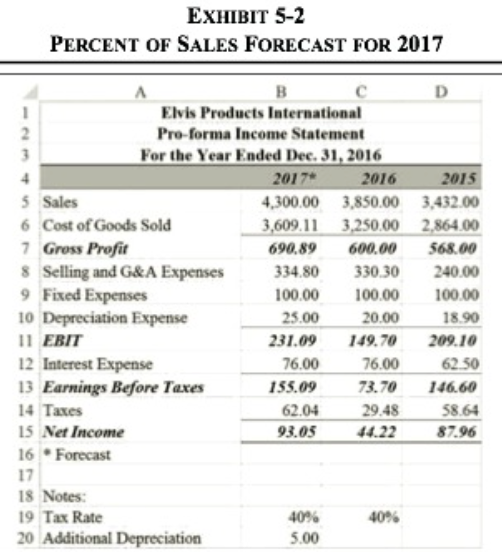
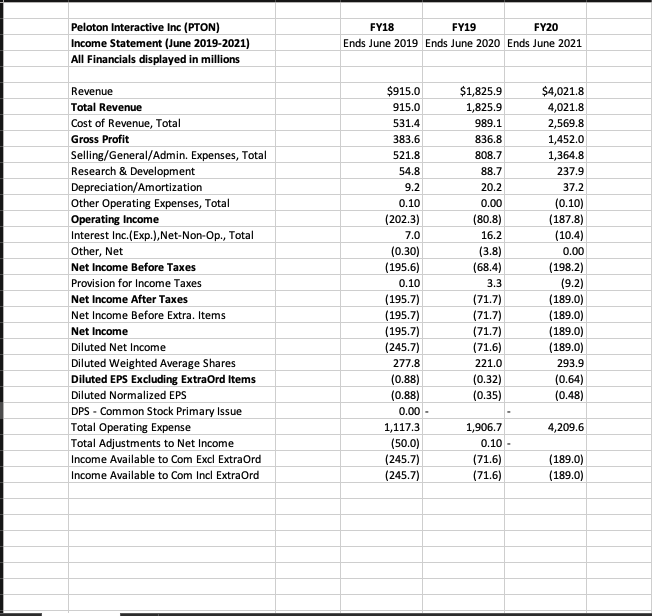
EXHIBIT 5-2 PERCENT OF SALES FORECAST FOR 2017 B D 1 Elvis Products International 2 Pro-forma Income Statement 3 For the Year Ended Dec. 31, 2016 4 2017 2016 2015 5 Sales 4,300.00 3,850.00 3,432.00 6 Cost of Goods Sold 3,609,11 3,250.00 2,864.00 7 Gross Profit 690.89 600.00 568.00 8 Selling and G&A Expenses 334.80 330.30 240,00 9 Fixed Expenses 100.00 100.00 100.00 10 Depreciation Expense 25.00 20.00 18.90 11 EBIT 231.09 149.70 209.10 12 Interest Expense 76.00 76.00 62.50 13 Earnings Before Taxes 155.09 73.70 146.60 14 Taxes 62.04 29.48 58.64 15 Net Income 93.05 44.22 87.96 16 Forecast 17 18 Notes: 19 Tax Rate 40% 40% 20 Additional Depreciation 5.00 Peloton Interactive Inc (PTON) Income Statement (June 2019-2021) All Financials displayed in millions FY18 FY19 FY20 Ends June 2019 Ends June 2020 Ends June 2021 Revenue Total Revenue Cost of Revenue, Total Gross Profit Selling/General/Admin. Expenses, Total Research & Development Depreciation/Amortization Other Operating Expenses, Total Operating Income Interest Inc. (Exp.),Net-Non-Op., Total Other, Net Net Income Before Taxes Provision for Income Taxes Net Income After Taxes Net Income Before Extra. Items Net Income Diluted Net Income Diluted Weighted Average Shares Diluted EPS Excluding Extraord Items Diluted Normalized EPS DPS - Common Stock Primary Issue Total Operating Expense Total Adjustments to Net Income Income Available to Com Excl Extraord Income Available to Com Incl Extra Ord $915.0 915.0 531.4 383.6 521.8 54.8 9.2 0.10 (202.3) 7.0 (0.30) (195.6) 0.10 (195.7) (195.7) (195.7) (245.7) 277.8 (0.88) (0.88) 0.00 - 1,117.3 (50.0) (245.7) (245.7) $1,825.9 1,825.9 989.1 836.8 808.7 88.7 20.2 0.00 (80.8) 16.2 (3.8) (68.4) 3.3 (71.7) (71.7) (71.7) (71.6) 221.0 (0.32) (0.35) $4,021.8 4,021.8 2,569.8 1,452.0 1,364.8 237.9 37.2 (0.10) (187.8) (10.4) 0.00 (198.2) (9.2) (189.0) (189.0) (189.0) (189.0) 293.9 (0.64) (0.48) 4,209.6 1,906.7 0.10 - (71.6) (71.6) (189.0) (189.0) EXHIBIT 5-2 PERCENT OF SALES FORECAST FOR 2017 B D 1 Elvis Products International 2 Pro-forma Income Statement 3 For the Year Ended Dec. 31, 2016 4 2017 2016 2015 5 Sales 4,300.00 3,850.00 3,432.00 6 Cost of Goods Sold 3,609,11 3,250.00 2,864.00 7 Gross Profit 690.89 600.00 568.00 8 Selling and G&A Expenses 334.80 330.30 240,00 9 Fixed Expenses 100.00 100.00 100.00 10 Depreciation Expense 25.00 20.00 18.90 11 EBIT 231.09 149.70 209.10 12 Interest Expense 76.00 76.00 62.50 13 Earnings Before Taxes 155.09 73.70 146.60 14 Taxes 62.04 29.48 58.64 15 Net Income 93.05 44.22 87.96 16 Forecast 17 18 Notes: 19 Tax Rate 40% 40% 20 Additional Depreciation 5.00 Peloton Interactive Inc (PTON) Income Statement (June 2019-2021) All Financials displayed in millions FY18 FY19 FY20 Ends June 2019 Ends June 2020 Ends June 2021 Revenue Total Revenue Cost of Revenue, Total Gross Profit Selling/General/Admin. Expenses, Total Research & Development Depreciation/Amortization Other Operating Expenses, Total Operating Income Interest Inc. (Exp.),Net-Non-Op., Total Other, Net Net Income Before Taxes Provision for Income Taxes Net Income After Taxes Net Income Before Extra. Items Net Income Diluted Net Income Diluted Weighted Average Shares Diluted EPS Excluding Extraord Items Diluted Normalized EPS DPS - Common Stock Primary Issue Total Operating Expense Total Adjustments to Net Income Income Available to Com Excl Extraord Income Available to Com Incl Extra Ord $915.0 915.0 531.4 383.6 521.8 54.8 9.2 0.10 (202.3) 7.0 (0.30) (195.6) 0.10 (195.7) (195.7) (195.7) (245.7) 277.8 (0.88) (0.88) 0.00 - 1,117.3 (50.0) (245.7) (245.7) $1,825.9 1,825.9 989.1 836.8 808.7 88.7 20.2 0.00 (80.8) 16.2 (3.8) (68.4) 3.3 (71.7) (71.7) (71.7) (71.6) 221.0 (0.32) (0.35) $4,021.8 4,021.8 2,569.8 1,452.0 1,364.8 237.9 37.2 (0.10) (187.8) (10.4) 0.00 (198.2) (9.2) (189.0) (189.0) (189.0) (189.0) 293.9 (0.64) (0.48) 4,209.6 1,906.7 0.10 - (71.6) (71.6) (189.0) (189.0)