

Question
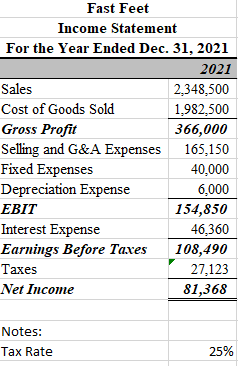
Fast Feet is a new specialty running shoe store in Lumberton, NC. Fast Feet started off with a very good first year, as it made
Fast Feet is a new specialty running shoe store in Lumberton, NC. Fast Feet started off with a very good first year, as it made a profit. 2022 is not looking as good, however, as increased supply prices and utilities have driven up the COGS and a decrease in store traffic has sales numbers down considerably from 2021. Fast Feet does not have much of a seasonal swing, and with the store being new, there is no long-term data by which forecasting can be done.
However, sales are currently averaging $142,867.08 per month through May 31, 2022. In that same time, the COGS has been $171,212.42. Obviously, Fast Feet cannot continue this same course the rest of the year. You have been contracted at a cost of $10,000 (administrative costs) to provide an analysis of what Fast Feet should do. The owner has asked that you provide these scenarios
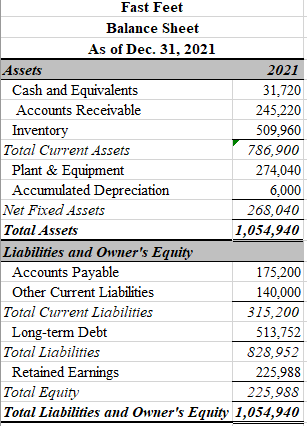
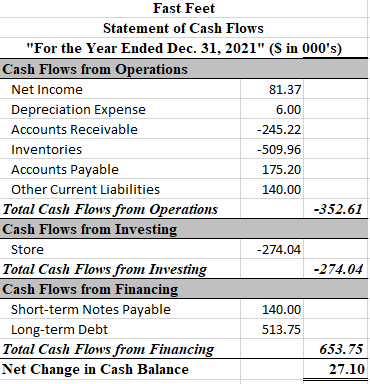
- Project the Income Statement, Balance Sheet, and Statement of Cash Flows for 2022
- Project the Income Statement, Balance Sheet, and Statement of Cash Flows for 2022, should Fast Feet take on a marketing campaign that should increase sales, from the first five-month average for 2022, by 21%. The campaign will cost Fast Feet $3,000 spread out over the last seven months of the year
Step by Step Solution
There are 3 Steps involved in it
Step: 1

Get Instant Access to Expert-Tailored Solutions
See step-by-step solutions with expert insights and AI powered tools for academic success
Step: 2

Step: 3
Ace Your Homework with AI
Get the answers you need in no time with our AI-driven, step-by-step assistance
Get Started
Return Distributions In Finance
Authors: Stephen Satchell, John Knight
1st Edition
0750647515, 978-0750647519