Answered step by step
Verified Expert Solution
Question
1 Approved Answer
FB 75.91 78.97 Nasdaq 4635.24 4963.53 4900.88 4941.42 82.22 78.77 79.19 5070.03 85.77 4986.87 94.01 5128.28 89.43 4776.51 4620.16 89.9 101.97 5053.75 104.24 5108.67 104.66


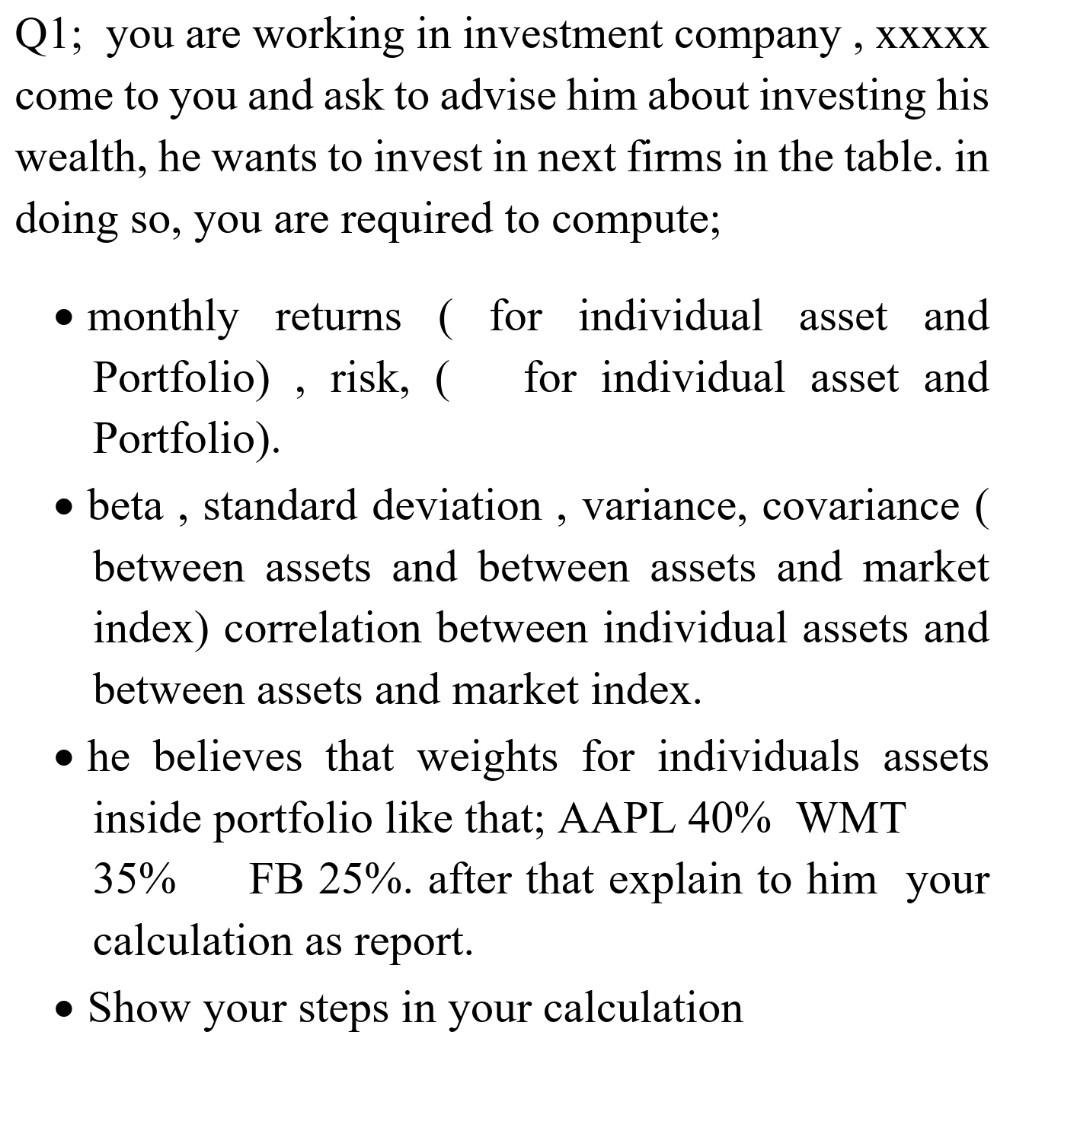
FB 75.91 78.97 Nasdaq 4635.24 4963.53 4900.88 4941.42 82.22 78.77 79.19 5070.03 85.77 4986.87 94.01 5128.28 89.43 4776.51 4620.16 89.9 101.97 5053.75 104.24 5108.67 104.66 5007.41 112.21 4613.95 4557.95 106.92 114.1 117.58 118.81 4869.85 4775.36 4948.05 114.28 4842.67 123.94 5162.13 126.12 5213.22 128.27 5312 130.99 5189.14 118.42 5323.68 115.05 130.32 5383.12 5614.79 5825.44 135.54 142.05 5911.74 Date AAPL WMT 1/1/2015 26.59675 73.16325 2/1/2015 29.16199 72.25925 3/1/2015 28.35861 70.81284 4/1/2015 28.5227 67.60051 5/1/2015 29.69186 64.32658 6/1/2015 28.70592 61.82145 7/1/2015 27.76073 62.73661 8/1/2015 25.80627 56.41763 9/1/2015 25.35753 56.89939 10/1/2015 27.47258 50.23012 11/1/2015 27.1967 51.63418 12/1/2015 24.30244 53.79292 1/1/2016 22.47387 58.72101 2/1/2016 22.3238 58.70332 3/1/2016 25.30017 60.60584 4/1/2016 21.76014 59.61038 5/1/2016 23.18079 63.09586 6/1/2016 22.32702 65.56928 7/1/2016 24.33785 65.52438 8/1/2016 24.77926 64.15049 9/1/2016 26.54543 65.20445 10/1/2016 26.66048 63.30581 11/1/2016 25.95136 63.67648 12/1/2016 27.33548 62.49211 1/1/2017 28.64066 60.77219 2/1/2017 32.33197 64.58753 3/1/2017 34.0532 65.6347 4/1/2017 34.05083 68.96086 5/1/2017 36.21027 72.09795 6/1/2017 34.27944 69.88405 7/1/2017 35.40052 73.86398 8/1/2017 39.03506 72.09103 9/1/2017 36.82749 72.60954 10/1/2017 40.39268 81.13049 11/1/2017 41.06413 90.34839 12/1/2017 40.58344 91.76083 1/1/2018 40.15179 99.57727 2/1/2018 42.71537 84.0802 3/1/2018 40.39977 83.1087 4/1/2018 39.79297 83.12496 5/1/2018 44.99645 77.562 6/1/2018 44.74454 80.9915 7/1/2018 45.99663 84.37677 8/1/2018 55.02241 90.64616 9/1/2018 54.75693 89.318 10/1/2018 53.08807 95.37651 11/1/2018 43.31751 92.87512 12/1/2018 38.39592 88.59516 1/1/2019 40.51361 91.6415 2/1/2019 42.14691 94.66337 3/1/2019 46.43454 93.26718 4/1/2019 49.05512 98.87426 5/1/2019 42.79703 97.52825 6/1/2019 48.56918 106.7936 7/1/2019 52.2796 106.6873 8/1/2019 51.2244 110.4375 150.25 6047.61 151.46 6198.52 150.98 6140.42 6348.12 169.25 171.97 6428.66 6495.96 170.87 180.06 177.18 6727.67 6873.97 176.46 6903.39 186.89 7411.48 178.32 7273.01 159.79 7063.45 172 7066.27 191.78 7442.12 194.32 7510.3 7671.79 172.58 8109.54 175.73 164.46 151.79 8046.35 7305.9 7330.54 140.61 131.09 6635.28 7281.74 166.69 161.45 166.69 7532.53 7729.32 8095.39 7453.15 193.4 177.47 193 8006.24 194.23 185.67 8175.42 7962.88 or Q1; you are working in investment company , XXXXX come to you and ask to advise him about investing his wealth, he wants to invest in next firms in the table. in doing so, you are required to compute; monthly returns ( for individual asset and Portfolio), risk, ( for individual asset and Portfolio). beta, standard deviation , variance, covariance between assets and between assets and market index) correlation between individual assets and between assets and market index. he believes that weights for individuals assets inside portfolio like that; AAPL 40% WMT 35% FB 25%. after that explain to him your calculation as report. Show your steps in your calculation FB 75.91 78.97 Nasdaq 4635.24 4963.53 4900.88 4941.42 82.22 78.77 79.19 5070.03 85.77 4986.87 94.01 5128.28 89.43 4776.51 4620.16 89.9 101.97 5053.75 104.24 5108.67 104.66 5007.41 112.21 4613.95 4557.95 106.92 114.1 117.58 118.81 4869.85 4775.36 4948.05 114.28 4842.67 123.94 5162.13 126.12 5213.22 128.27 5312 130.99 5189.14 118.42 5323.68 115.05 130.32 5383.12 5614.79 5825.44 135.54 142.05 5911.74 Date AAPL WMT 1/1/2015 26.59675 73.16325 2/1/2015 29.16199 72.25925 3/1/2015 28.35861 70.81284 4/1/2015 28.5227 67.60051 5/1/2015 29.69186 64.32658 6/1/2015 28.70592 61.82145 7/1/2015 27.76073 62.73661 8/1/2015 25.80627 56.41763 9/1/2015 25.35753 56.89939 10/1/2015 27.47258 50.23012 11/1/2015 27.1967 51.63418 12/1/2015 24.30244 53.79292 1/1/2016 22.47387 58.72101 2/1/2016 22.3238 58.70332 3/1/2016 25.30017 60.60584 4/1/2016 21.76014 59.61038 5/1/2016 23.18079 63.09586 6/1/2016 22.32702 65.56928 7/1/2016 24.33785 65.52438 8/1/2016 24.77926 64.15049 9/1/2016 26.54543 65.20445 10/1/2016 26.66048 63.30581 11/1/2016 25.95136 63.67648 12/1/2016 27.33548 62.49211 1/1/2017 28.64066 60.77219 2/1/2017 32.33197 64.58753 3/1/2017 34.0532 65.6347 4/1/2017 34.05083 68.96086 5/1/2017 36.21027 72.09795 6/1/2017 34.27944 69.88405 7/1/2017 35.40052 73.86398 8/1/2017 39.03506 72.09103 9/1/2017 36.82749 72.60954 10/1/2017 40.39268 81.13049 11/1/2017 41.06413 90.34839 12/1/2017 40.58344 91.76083 1/1/2018 40.15179 99.57727 2/1/2018 42.71537 84.0802 3/1/2018 40.39977 83.1087 4/1/2018 39.79297 83.12496 5/1/2018 44.99645 77.562 6/1/2018 44.74454 80.9915 7/1/2018 45.99663 84.37677 8/1/2018 55.02241 90.64616 9/1/2018 54.75693 89.318 10/1/2018 53.08807 95.37651 11/1/2018 43.31751 92.87512 12/1/2018 38.39592 88.59516 1/1/2019 40.51361 91.6415 2/1/2019 42.14691 94.66337 3/1/2019 46.43454 93.26718 4/1/2019 49.05512 98.87426 5/1/2019 42.79703 97.52825 6/1/2019 48.56918 106.7936 7/1/2019 52.2796 106.6873 8/1/2019 51.2244 110.4375 150.25 6047.61 151.46 6198.52 150.98 6140.42 6348.12 169.25 171.97 6428.66 6495.96 170.87 180.06 177.18 6727.67 6873.97 176.46 6903.39 186.89 7411.48 178.32 7273.01 159.79 7063.45 172 7066.27 191.78 7442.12 194.32 7510.3 7671.79 172.58 8109.54 175.73 164.46 151.79 8046.35 7305.9 7330.54 140.61 131.09 6635.28 7281.74 166.69 161.45 166.69 7532.53 7729.32 8095.39 7453.15 193.4 177.47 193 8006.24 194.23 185.67 8175.42 7962.88 or Q1; you are working in investment company , XXXXX come to you and ask to advise him about investing his wealth, he wants to invest in next firms in the table. in doing so, you are required to compute; monthly returns ( for individual asset and Portfolio), risk, ( for individual asset and Portfolio). beta, standard deviation , variance, covariance between assets and between assets and market index) correlation between individual assets and between assets and market index. he believes that weights for individuals assets inside portfolio like that; AAPL 40% WMT 35% FB 25%. after that explain to him your calculation as report. Show your steps in your calculation
Step by Step Solution
There are 3 Steps involved in it
Step: 1

Get Instant Access to Expert-Tailored Solutions
See step-by-step solutions with expert insights and AI powered tools for academic success
Step: 2

Step: 3

Ace Your Homework with AI
Get the answers you need in no time with our AI-driven, step-by-step assistance
Get Started


