Answered step by step
Verified Expert Solution
Question
1 Approved Answer
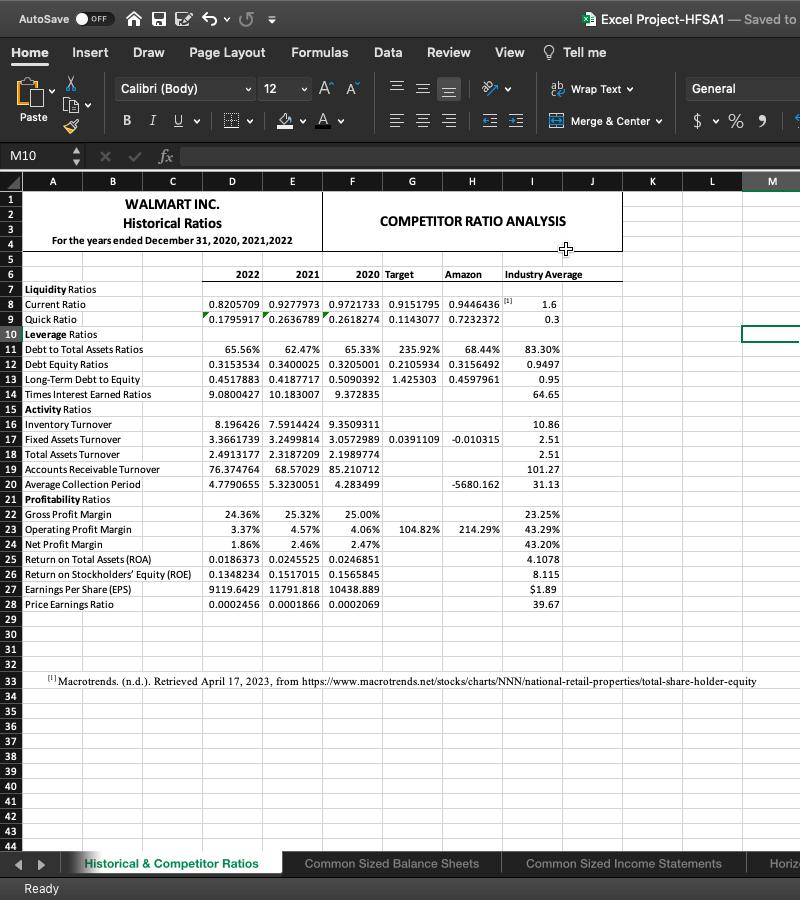
FedEx Corp. Key conclusions drawn from the company's last 3 years of ratios, as well as a comparison to industry averages and competitors. Should include
FedEx Corp.
Key conclusions drawn from the company's last 3 years of ratios, as well as a comparison to industry averages and competitors. Should include a discussion for each major category of ratios, including liquidity, solvency/leverage, efficiency,
profitability, and market value

AutoSave OFF + 5 = Home Insert Draw Page Layout M10 1 2 3 4 Paste 5 6 7 Liquidity Ratios 8 Current Ratio 9 Quick Ratio A 10 Leverage Ratios 11 Debt to Total Assets Ratios 12 Debt Equity Ratios 13 Long-Term Debt to Equity 14 Times Interest Earned Ratios B 15 Activity Ratios 16 Inventory Turnover 17 Fixed Assets Turnover 30 31 32 Calibri (Body) BI U 18 Total Assets Turnover 19 Accounts Receivable Turnover 20 Average Collection Period 21 Profitability Ratios 22 Gross Profit Margin 33 34 35 36 37 38 39 40 41 42 23 Operating Profit Margin 24 Net Profit Margin 43 44 25 Return on Total Assets (ROA) 26 Return on Stockholders' Equity (ROE) 27 Earnings Per Share (EPS) 28 Price Earnings Ratio 29 WALMART INC. Historical Ratios For the years ended December 31, 2020, 2021,2022 C Ready D 2022 12 Formulas Data Review A A A E 2021 V Historical & Competitor Ratios F G 2020 Target H COMPETITOR RATIO ANALYSIS 24.36% 25.32% 25.00% 3.37% 4.57% 4.06% 1.86% 2.46% 2.47% 0.0186373 0.0245525 0.0246851 0.1348234 0.1517015 0.1565845 9119.6429 11791.818 10438.889 0.0002456 0.0001866 0.0002069 0.8205709 0.9277973 0.9721733 0.9151795 0.9446436 0.1795917 0.2636789 0.2618274 0.1143077 0.7232372 View 65.56% 62.47% 65.33% 235.92% 68.44% 0.3153534 0.3400025 0.3205001 0.2105934 0.3156492 0.4517883 0.4187717 0.5090392 1.425303 0.4597961 9.0800427 10.183007 9.372835 8.196426 7.5914424 9.3509311 3.3661739 3.2499814 3.0572989 0.0391109 -0.010315 2.4913177 2.3187209 2.1989774 76.374764 68.57029 85.210712 4.7790655 5.3230051 4.283499 104.82% Amazon Industry Average -5680.162 214.29% Common Sized Balance Sheets [1] 1.6 0.3 83.30% 0.9497 0.95 64.65 10.86 2.51 2.51 101.27 31.13 Tell me 23.25% 43.29% 43.20% 4.1078 8.115 $1.89 39.67 Excel Project-HFSA1 - Saved to Wrap Text Merge & Center K General []Macrotrends. (n.d.). Retrieved April 17, 2023, from https://www.macrotrends.net/stocks/charts/NNN/national-retail-properties/total-share-holder-equity V L Common Sized Income Statements M Horiz
Step by Step Solution
There are 3 Steps involved in it
Step: 1
Here are the key conclusions that can be drawn from FedEx Corps financial ratios over the last 3 yea...
Get Instant Access to Expert-Tailored Solutions
See step-by-step solutions with expert insights and AI powered tools for academic success
Step: 2

Step: 3

Ace Your Homework with AI
Get the answers you need in no time with our AI-driven, step-by-step assistance
Get Started


