Answered step by step
Verified Expert Solution
Link Copied!

Question

1 Approved Answer

Feel free to use R code. you can copy data here: Stock 1 2 3 4 5 6 7 8 9 10 11 12 13

Feel free to use R code. you can copy data here:

Stock 1 2 3 4 5 6 7 8 9 10 11 12 13 14

Before 52.70 18.11 7.33 11.52 21.14 4.31 11.09 14.22 9.92 7.13 0.17 1.62 82.75 8.09

After 54.32 29.31 2.91 9.78 27.39 5.50 12.11 18.44 10.00 6.64 0.89 1.87 71.51 5.95
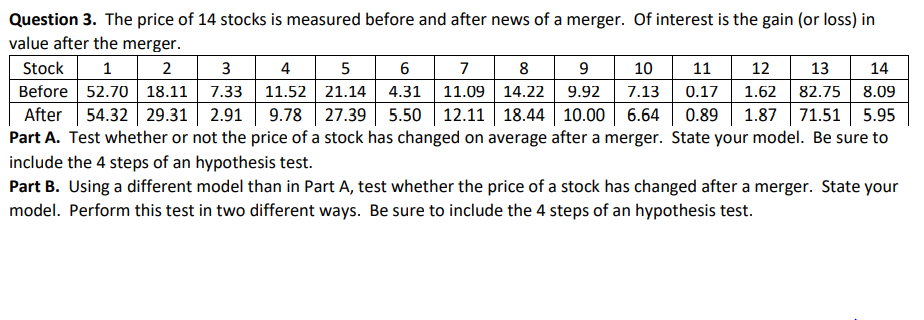
image text in transcribed
Question 3. The price of 14 stocks is measured before and after news of a merger. Of interest is the gain [or loss] in value after the merger. 3 I1 5 5 7 8 9 10 11 12 13 14 Before 52.70 18.11 7.33 11.52 21.14 4.31 11.09 14.22 9.92 7.13 (L17 1.52 32.75 3.09 After 54-32 29.31 2.91 9.73 2139 5.50 12.11 18:14 10.00 5.6 0-39 1.87 11.51 5.95 Part A. Test whether or not the price of a stock has changed on average after a merger. State your model. Be sure to include the 4 steps of an hypothesis test. Part B. Using a different model than in Part A, test whether the price of a stock has changed after a merger. State your model. Perform this test in two different ways. Be sure to include the 4 steps of an hypothesis test

Step by Step Solution

There are 3 Steps involved in it

Step: 1

blur-text-image

Get Instant Access to Expert-Tailored Solutions

See step-by-step solutions with expert insights and AI powered tools for academic success

Step: 2

blur-text-image

Step: 3

blur-text-image

Ace Your Homework with AI

Get the answers you need in no time with our AI-driven, step-by-step assistance

Get Started

Recommended Textbook for

Algebra And Trigonometry

Authors: Cynthia Y Young

3rd Edition

1118475755, 9781118475751

More Books

Students also viewed these Mathematics questions

Question

D How will your group react to this revelation?

Answered: 1 week ago