Ferris Company began 2018 with 6,000 units of its principal product. The cost of each unit is $8. Merchandise transactions for the month of January
Ferris Company began 2018 with 6,000 units of its principal product. The cost of each unit is $8. Merchandise transactions for the month of January 2018 are as follows:
PLEASE FIX AND COMPLETE THE ANSWER IS NOT COMPLETE AND NOT CORRECT
| | Purchases |
| Date of Purchase | Units | | Unit Cost* | Total Cost |
| Jan. 10 | 5,000 | | $ | 9 | | | $ | 45,000 | |
| Jan. 18 | 6,000 | | | 10 | | | | 60,000 | |
| Totals | 11,000 | | | | | | | 105,000 | |
| |
* Includes purchase price and cost of freight.
| Sales |
| Date of Sale | Units | |
| Jan. 5 | 3,000 | |
| Jan. 12 | 2,000 | |
| Jan. 20 | 4,000 | |
| Total | 9,000 | |
| |
8,000 units were on hand at the end of the month. Required: Calculate January's ending inventory and cost of goods sold for the month using each of the following alternatives: 1. FIFO, periodic system. 2. LIFO, periodic system. 3. LIFO, perpetual system. 4. Average cost, periodic system. 5. Average cost, perpetual system.
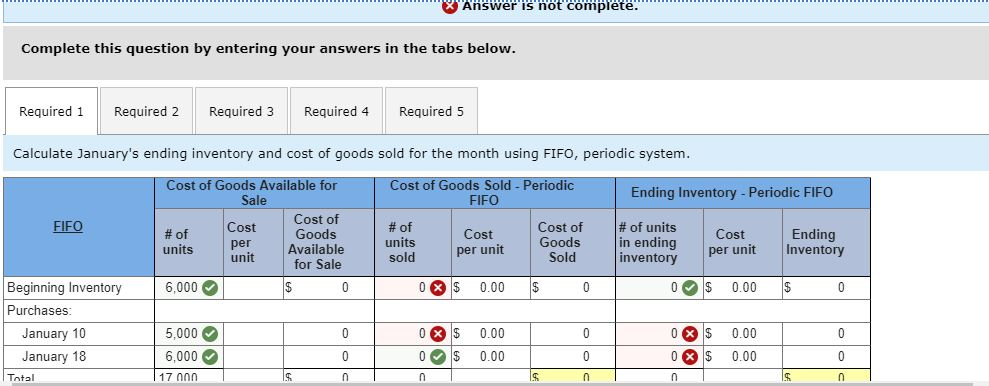
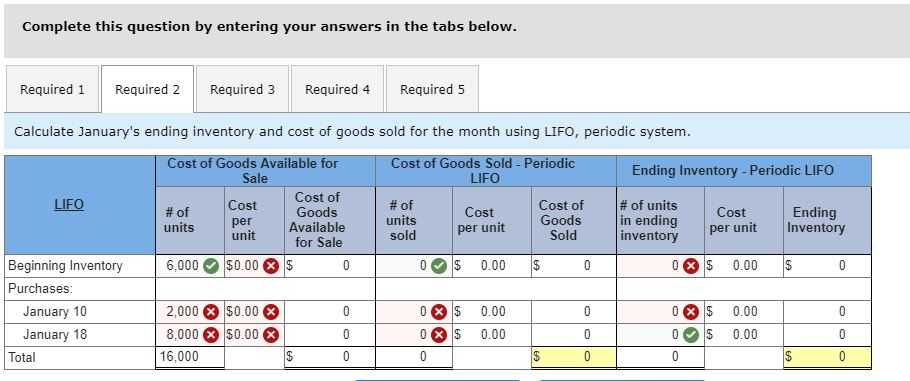
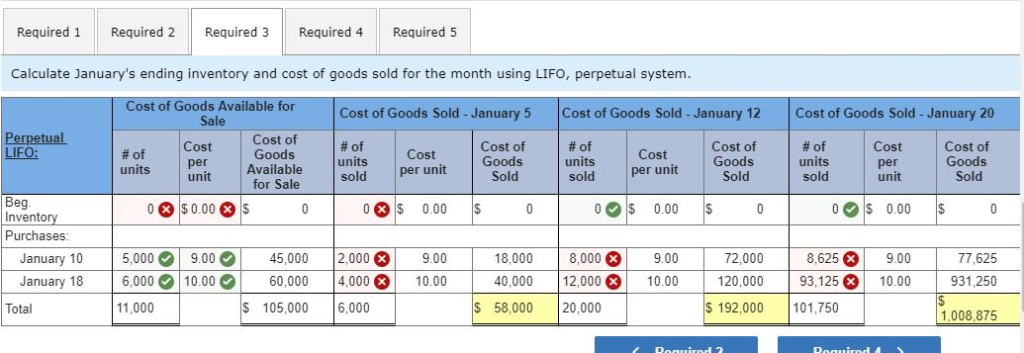
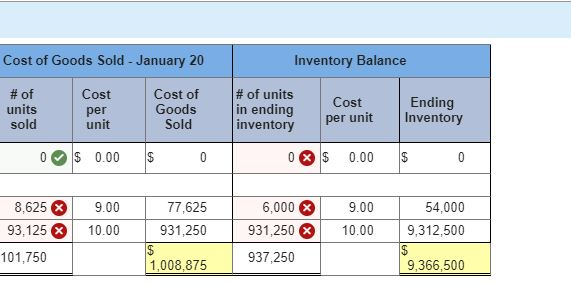
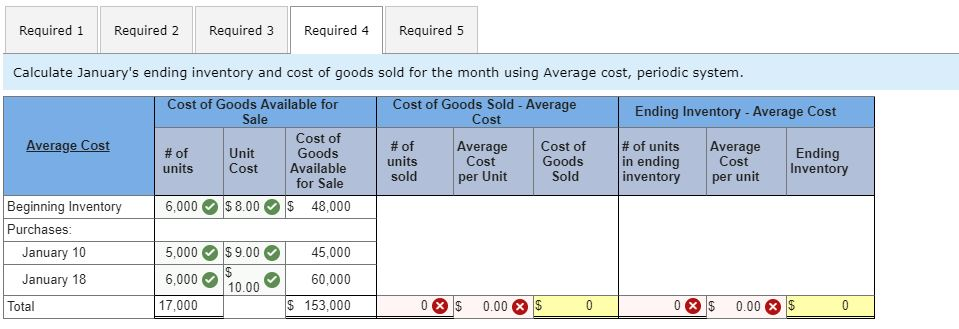
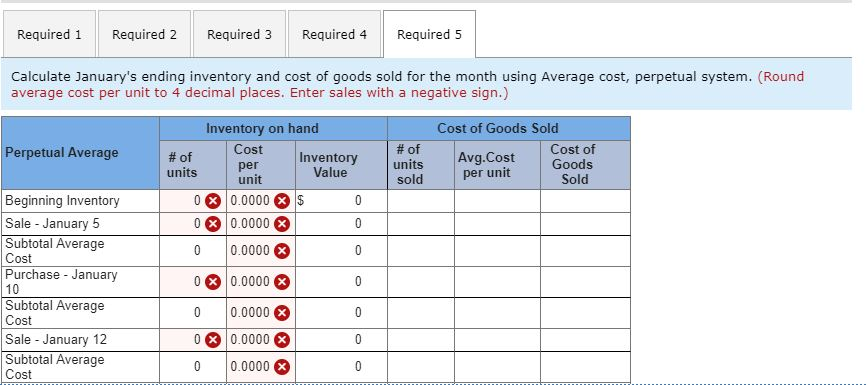
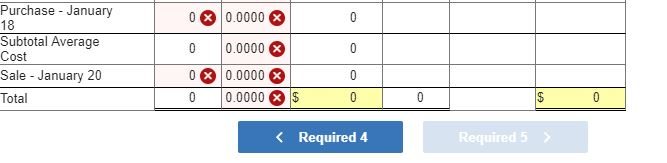
Complete this question by entering your answers in the tabs below. Required 2 Required 4 Required 1 Required 3 Required 5 Calculate January's ending inventory and cost of goods sold for the month using LIFO, periodic system Cost of Goods Available for Cost of Goods Sold - Periodic Ending Inventory -Periodic LIFO Sale LIFO Cost of Goods Available for Sale # of units in ending inventory Cost LIFO Cost of Goods Sold #of units sold #of units Cost Cost Ending Inventory per unit per unit per unit Beginning Inventory Purchases: January 10 January 18 $0.00 6,000 0 $ 0.00 0.00 0 2,000 S0.00 $0.00 0 x$ 0xS 0.00 0 0.00 0 $ 8,000 0 $ 0.00 0 0.00 0 16,000 C 0 Total A Required 1 Required 5 Required 2 Required 3 Required 4 Calculate January's ending inventory and cost of goods sold for the month using LIFO, perpetual system. Cost of Goods Available for Sale Cost of Goods Sold - January 5 Cost of Goods Sold - January 12 Cost of Goods Sold - January 20 Perpetual LIFO: Cost of Goods Available for Sale Cost #of units sold Cost of s Seld #of Cost of of Cost Cost of # of units Cost Cost Goods Goods units sold per unit per unit units sold per unit per unit Sold Sold Beg Inventory Purchases: 0 0.00 $0.00 S $ $ 0S 0 0.00 0 0 0 0.00 0 5,000 9.00 6,000 10.00 18,000 January 10 45,000 2,000 9.00 8,000 9.00 72,000 8,625 9.00 77,625 January 18 60,000 4,000 10.00 40,000 12,000 10.00 120,000 93,125 10.00 931 250 11,000 $192,000 $ 58,000 $ 105,000 6.000 20,000 101,750 Total 1,008,875 Doauirod 2 Doauirod Inventory Balance Cost of Goods Sold January 20 #of units in ending inventory of units sold Cost Cost of Goods Sold Cost Ending Inventory per unit per unit $ 0.00 C 0 0.00 0 8,625 9.00 77,625 6,000 9.00 54,000 93,125 10.00 931,250 931,250 10.00 9,312,500 101,750 937,250 1,008,875 9,366,500 Required 1 Required 5 Required 2 Required 3 Required 4 Calculate January's ending inventory and cost of goods sold for the month using Average cost, periodic system. Cost of Goods Available for Sale Cost of Goods Sold - Average Cost Ending Inventory -Average Cost Cost of Goods Available for Sale Average # of units in ending inventory Average Cost #of units sold Cost of Goods Sold Average Cost per unit #of Unit Ending Inventory Cost units Cost per Unit Beginning Inventory 6,000 $8.00 48,000 Purchases: 5,000 $9.00 January 10 45,000 6,000 10.00 January 18 60,000 $ 153,000 0 S 0.00 $ 0 0 17,000 0 0.00 0 Total Required 1 Required 2 Required 3 Required 4 Required 5 Calculate January's ending inventory and cost of goods sold for the month using Average cost, perpetual system. (Round average cost per unit to 4 decimal places. Enter sales with a negative sign.) Inventory on hand Cost of Goods Sold Perpetual Average Cost # of units sold Cost of Goods Sold Avg.Cost per unit Inventory Value #of per unit units Beginning Inventory Sale - January 5 Subtotal Average 0.0000 0 00.0000 0 0.0000 C 0 Cost Purchase - January 0.0000 0 10 Subtotal Average 0.0000 0 Cost Sale January 12 Subtotal Average 0.0000 0 0.0000 0 Cost Purchase January 0 x 0.0000 18 Subtotal Average Cost 0.0000 0 0 Sale January 20 0 0.0000 Total 0.0000 0 0 Required 4 Required 5