Question
FGURE1 FGURE2 FGURE3 FGURE 4 FGURE 1 Original data graph FGURE 2 gaussian fitting graph [=14, Amplitude=3000000, =0.005, Constant=10 ] FGURE 3 gaussian fitting graph
FGURE1 FGURE2
 FGURE3
 FGURE 4
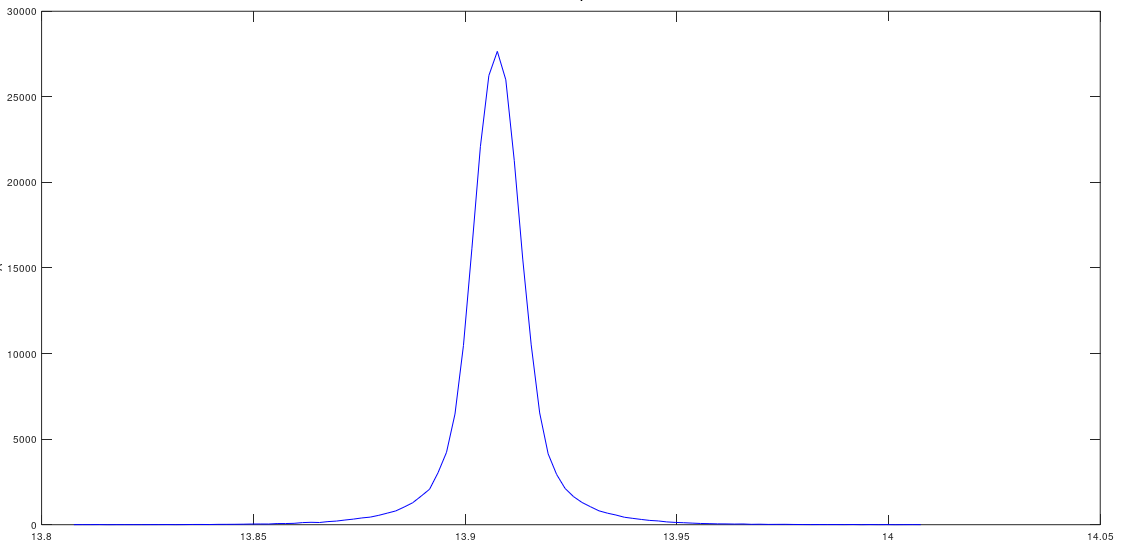
FGURE 1 Original data graph
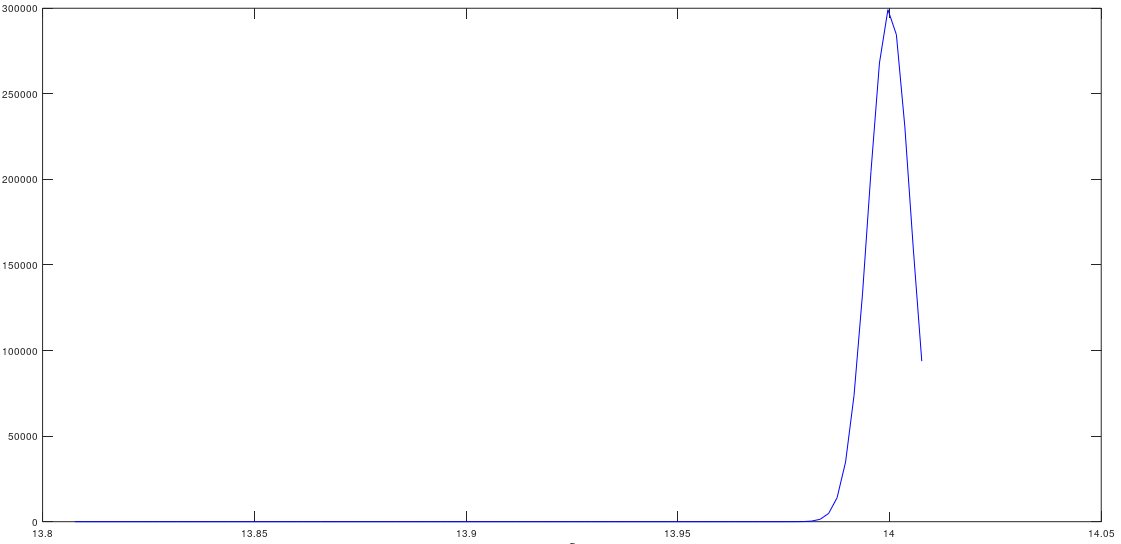
FGURE 2 gaussian fitting graph [=14, Amplitude=3000000, =0.005, Constant=10 ]
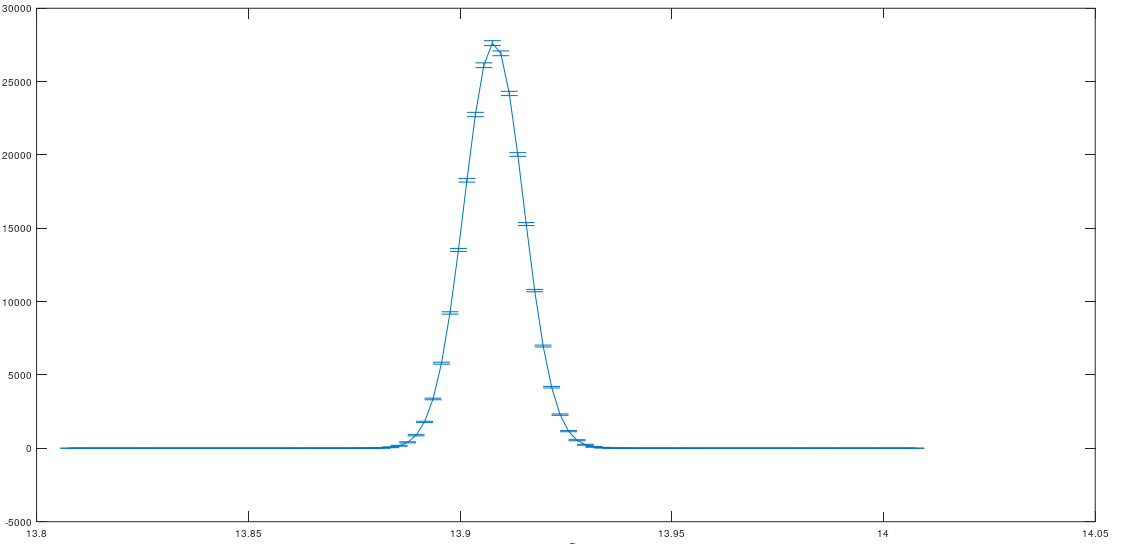
FGURE 3 gaussian fitting graph [=13.906, Amplitude=27650, =0.007, Constant=10 ]
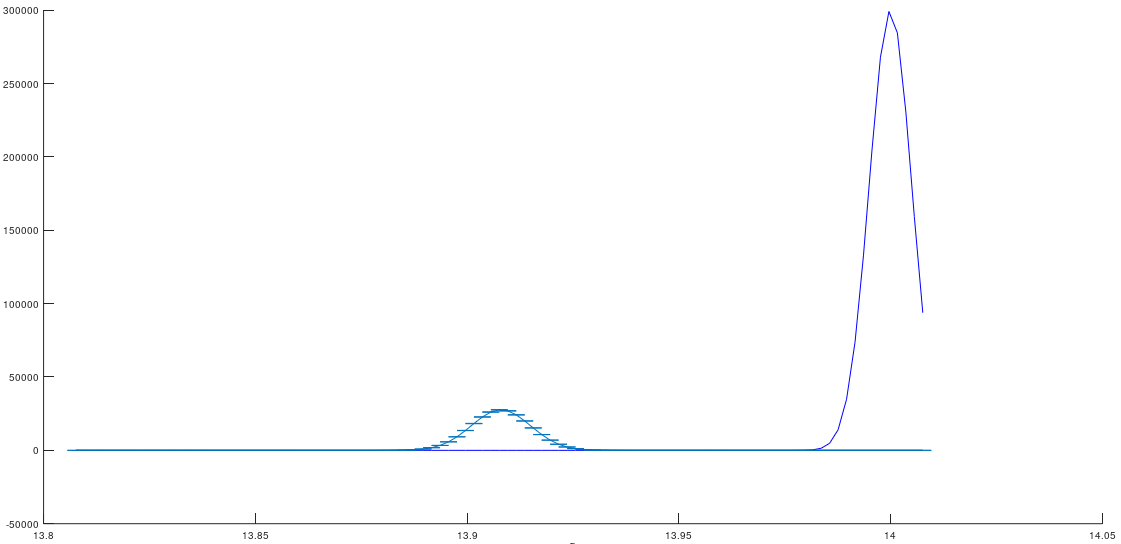
FGURE 4 FGURE 2 Vs FGURE 3
gauss fit equation used;

The 1st graph is the original data graph, and the 2nd graph and 3rd graph are graphs with gaussian fit applied according to these data. To create the second graph, the fit values are given in the question. The fit values of the 3rd graph were chosen from the original graph as it should be. The 4th graph is the 2nd and 3rd graphs drawn in the same place. (Maybe it will be useful for comparison.)
a-) Explain what happens in the 2nd graph. and explain why? (what's wrong, what's right, why shouldn't it be, etc.)
b-) Compare the 2nd and 3rd graphs ?
These are the outputs of the written code and it is necessary to comment on them, so please do not write code, just write the correct answers of a and b with this data.
30000 25000 20000 15000 10000 5000 13.8 13.85 13.9 13.95 14 14.05 300000 250000 200000 150000 100000 50000 13.8 13.85 13.9 13.95 14 14.05 30000 25000 20000 == 15000 EE 10000 5000 0 -5000 13.8 1 14 13.85 13.9 13.95 14.05 300000 250000 200000 150000 100000 50000 0 -50000 13.8 13.85 13.9 13.95 14 14.05 x) = g(x) = Ae (x-u)2 4 202 ,2 +C = 293 x 94Step by Step Solution
There are 3 Steps involved in it
Step: 1

Get Instant Access to Expert-Tailored Solutions
See step-by-step solutions with expert insights and AI powered tools for academic success
Step: 2

Step: 3

Ace Your Homework with AI
Get the answers you need in no time with our AI-driven, step-by-step assistance
Get Started


