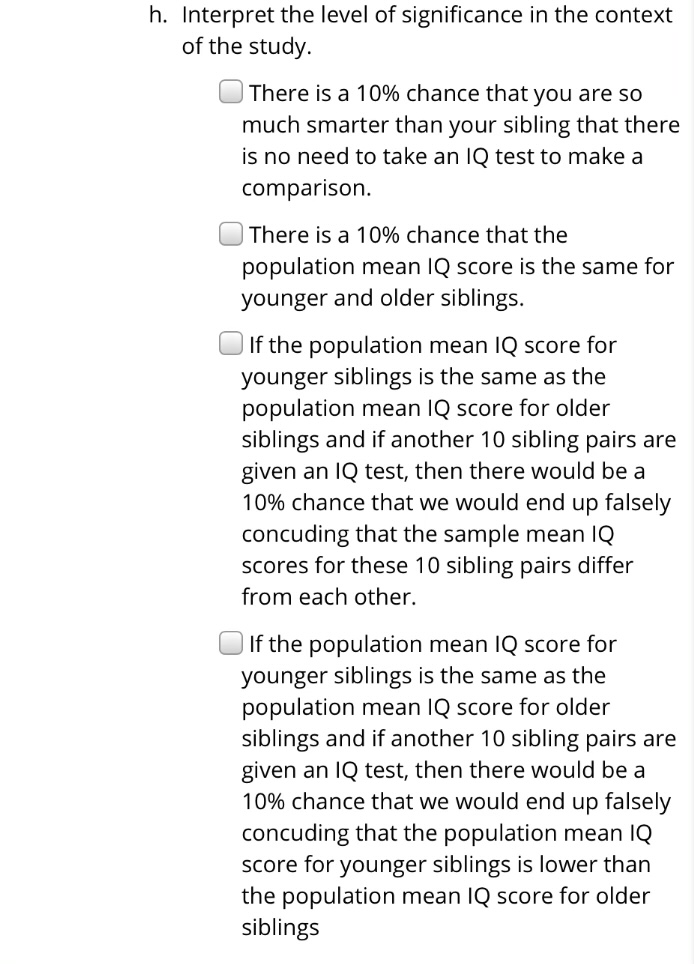
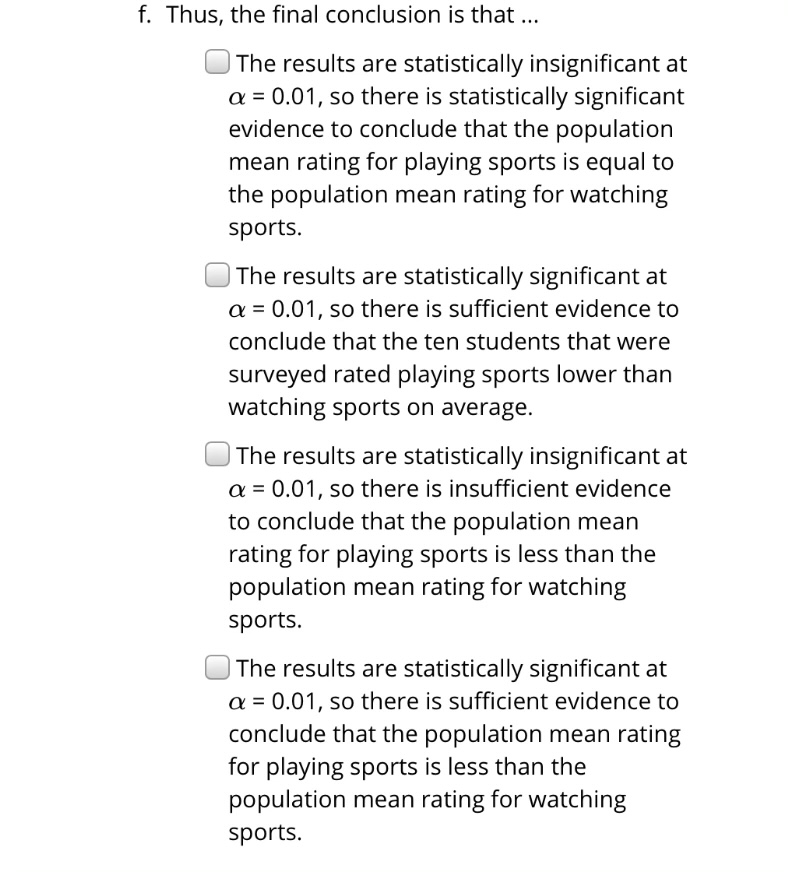
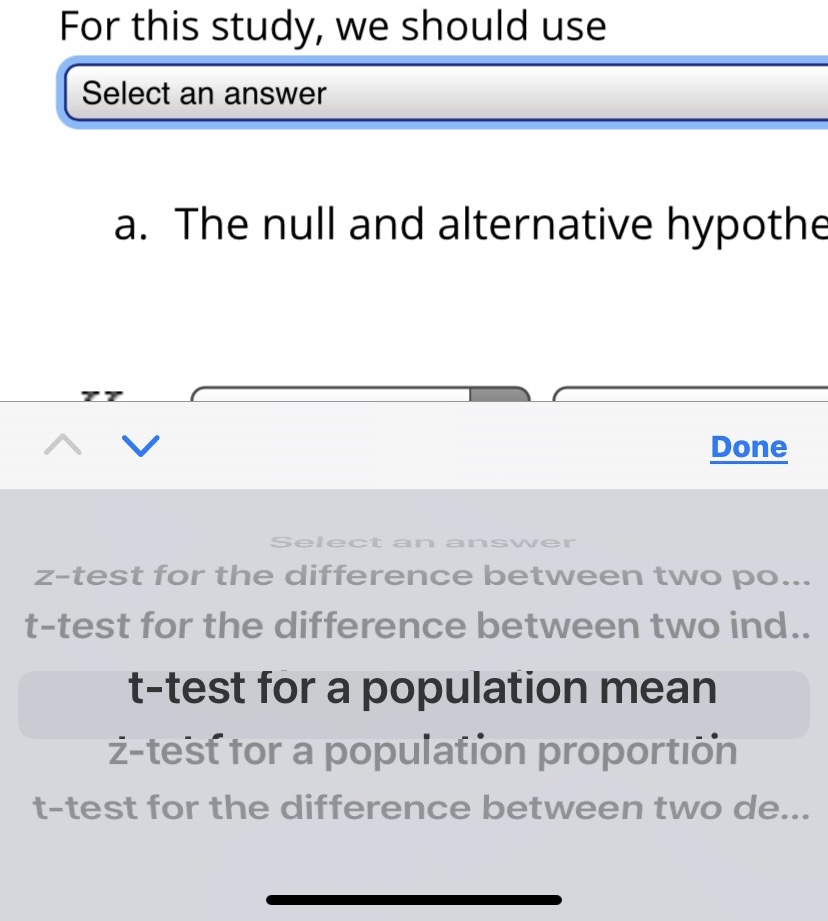
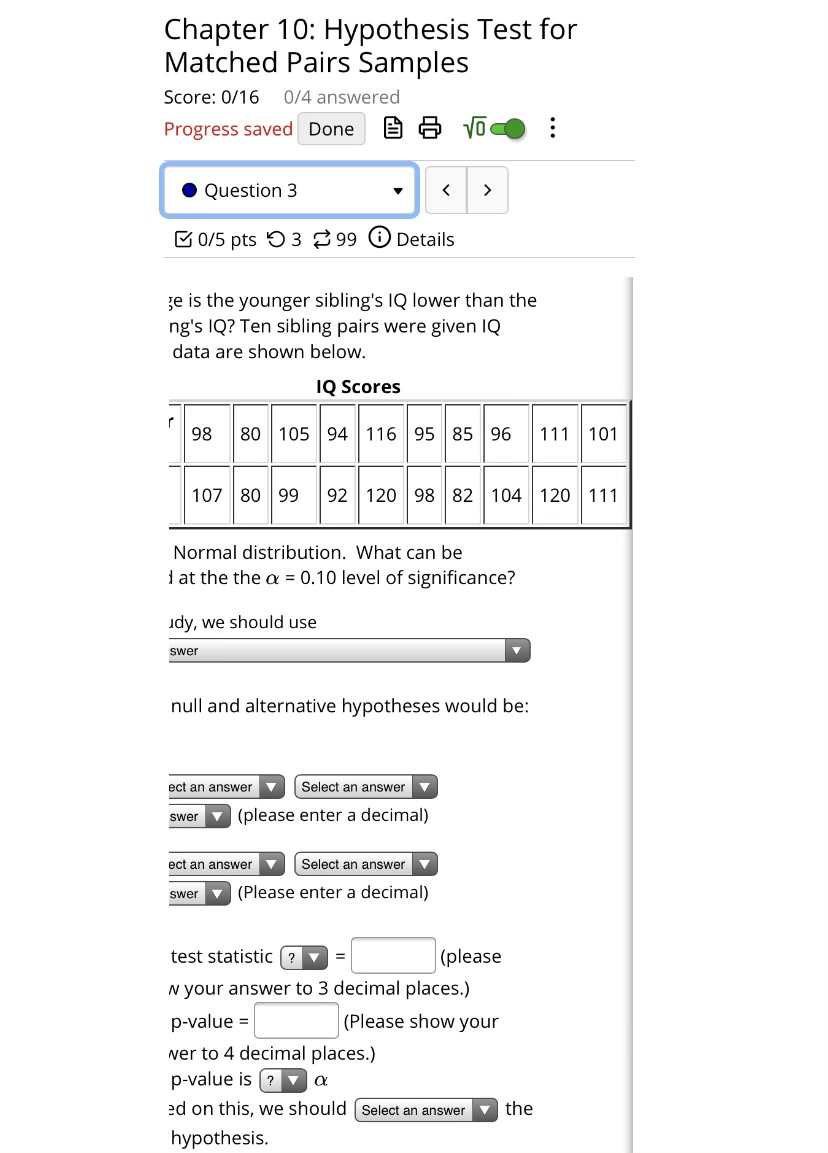
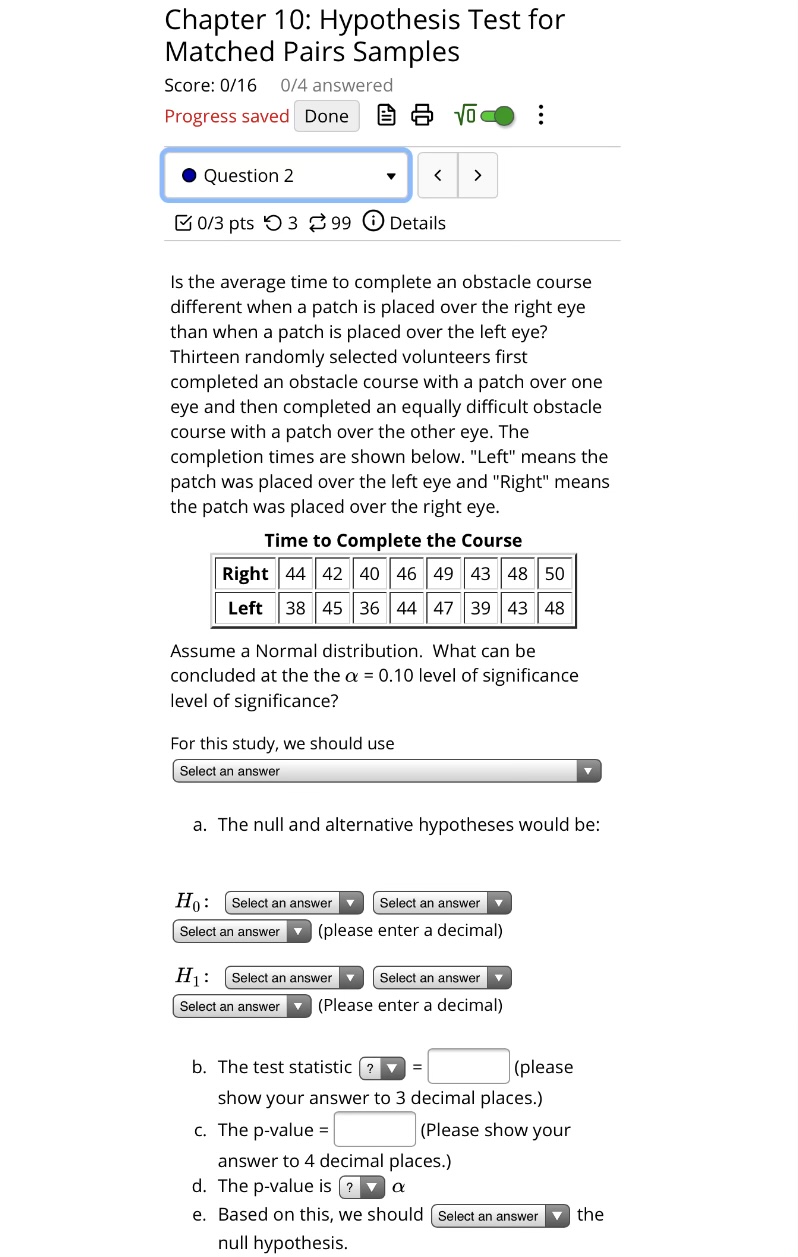
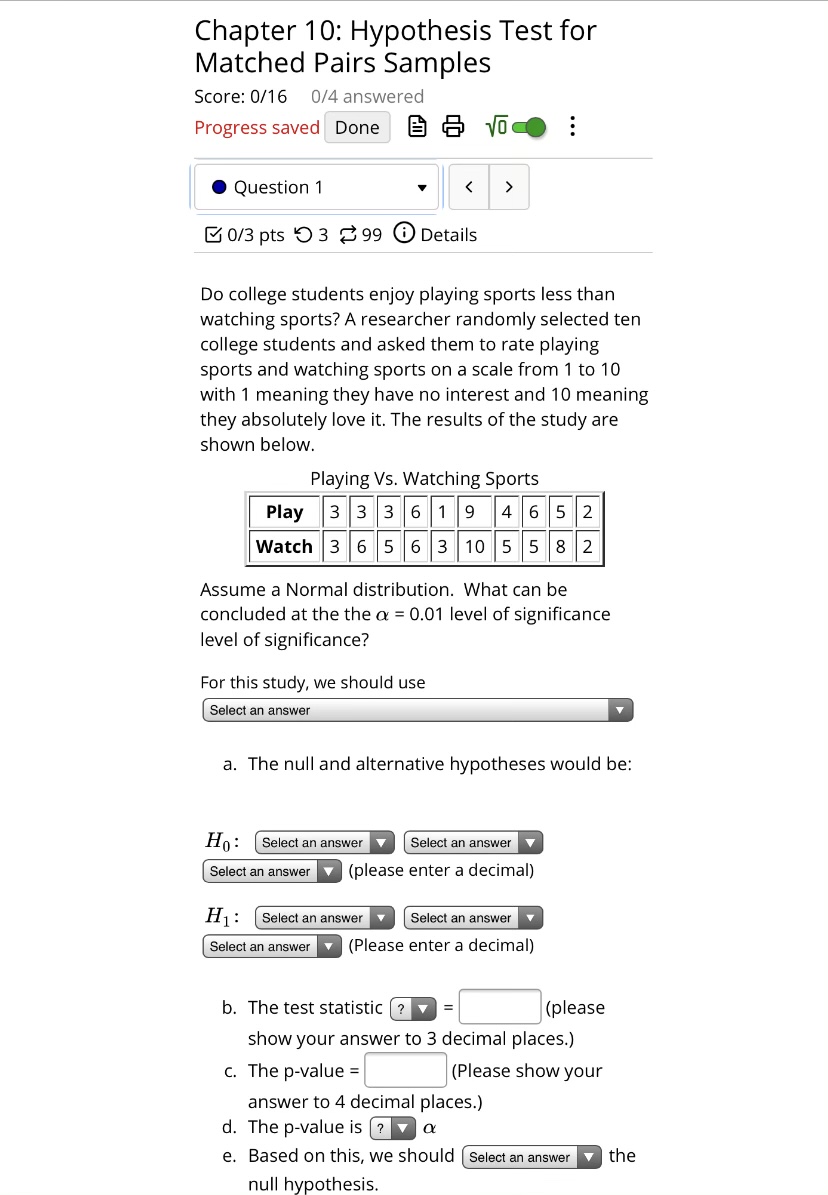
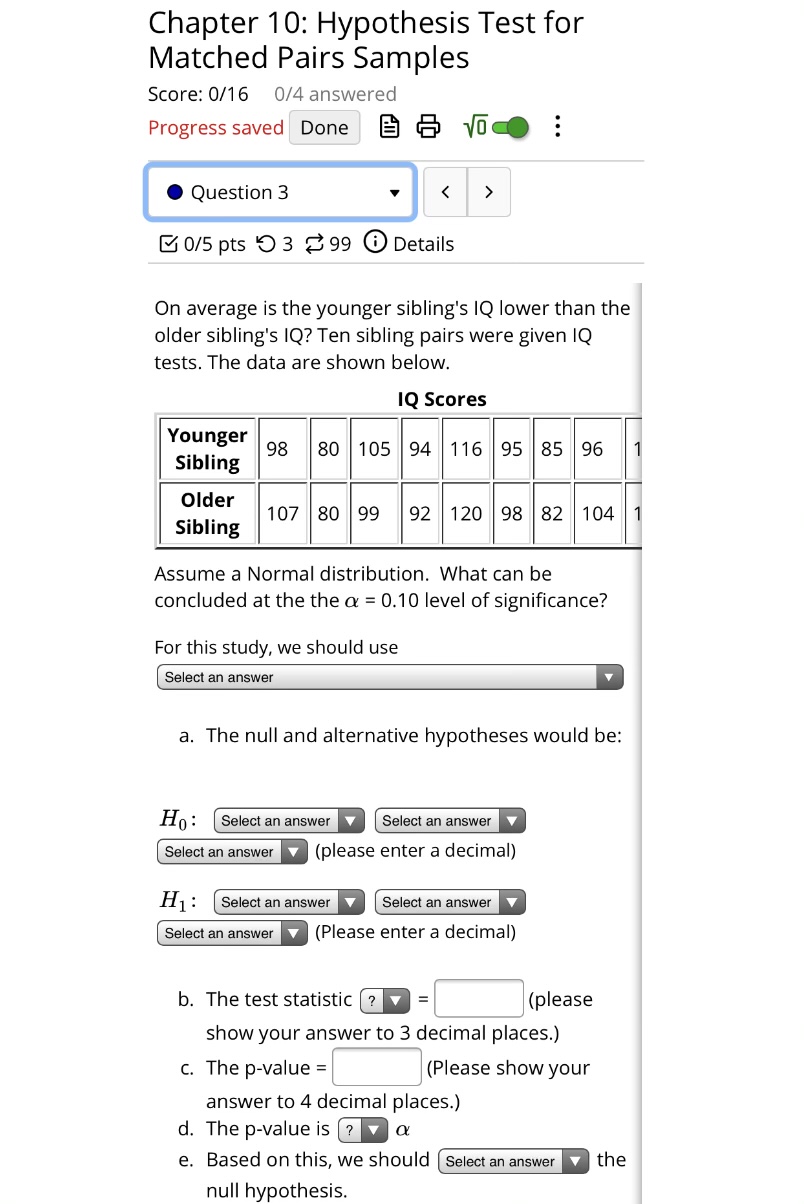
\fh. Interpret the level of significance in the context of the study. C] There is a 10% chance that you are so much smarter than your sibling that there is no need to take an IQ test to make a comparison. C] There is a 10% chance that the population mean IQ score is the same for younger and older siblings. C] If the population mean IQ score for younger siblings is the same as the population mean IQ score for older siblings and if another 10 sibling pairs are given an IQ test, then there would be a 10% chance that we would end up falsely concuding that the sample mean IQ scores for these 10 sibling pairs differ from each other. C] If the population mean IQ score for younger siblings is the same as the population mean IQ score for older siblings and if another 10 sibling pairs are given an IQ test, then there would be a 10% chance that we would end up falsely concuding that the population mean IQ score for younger siblings is lower than the population mean IQ score for older siblings f. Thus. the final conclusion is that C] The results are statistically insignificant at o: = 0.01, so there is statistically significant evidence to conclude that the population mean rating for playing sports is equal to the population mean rating for watching sports. C] The results are statistically significant at o: = 0.01, so there is sufcient evidence to conclude that the ten students that were surveyed rated playing sports lower than watching sports on average. [3 The results are statistically insignificant at o: = 0.01, so there is insufficient evidence to conclude that the population mean rating for playing sports is less than the population mean rating for watching Sports. C] The results are statistically significant at o: = 0.01, so there is sufcient evidence to conclude that the population mean rating for playing sports is less than the population mean rating for watching sports. \fFor this study, we should use a. The null and alternative hypothe A V Done Chapter 10: Hypothesis Test for Matched Pairs Samples Score: 0/16 0/4 answered Progress saved Done B & Voce . . . . Question 3 0/5 pts 9 3 99 0 Details je is the younger sibling's IQ lower than the ng's IQ? Ten sibling pairs were given IQ data are shown below. IQ Scores 98 80 |105 94 116 95 85 96 111 101 107 80 99 92 120 98 82 104 120 111 Normal distribution. What can be I at the the o = 0.10 level of significance? Idy, we should use swer null and alternative hypotheses would be: ect an answer Select an answer V swer v (please enter a decimal) ect an answer Select an answer swer v (Please enter a decimal) test statistic (? E (please N your answer to 3 decimal places.) p-value = (Please show your wer to 4 decimal places.) p-value is ? a ed on this, we should ( Select an answer V the hypothesis.f. Thus, the final conclusion is that ... OThe results are statistically significant at a = 0.10, so there is sufficient evidence to conclude that the eight volunteers that were completed the course in the same amount of time on average with the patch over the right eye compared to the left eye. The results are statistically insignificant at a = 0.10, so there is insufficient evidence to conclude that the population mean time to complete the obstacle course with a patch over the right eye is not the same as the population mean time to complete the obstacle course with a patch over the left eye. The results are statistically insignificant at a = 0.10, so there is statistically significant evidence to conclude that the population mean time to complete the obstacle course with a patch over the right eye is equal to the population mean time to complete the obstacle course with a patch over the left eye. The results are statistically significant at a = 0.10, so there is sufficient evidence to conclude that the population mean time to complete the obstacle course with a patch over the right eye is not the same as the population mean time to complete the obstacle course with a patch over the left eye.f. Thus, the nal conclusion is that C] The results are statistically signicant at o: = 0.10, so there is sufficient evidence to conclude that the ten younger siblings' IQ scores are lower on average than the ten older siblings' IQ scores. DThe results are statistically insignicant at a = 0.10. so there is statisticaliy significant evidence to conclude that the population mean IQ score for younger siblings is equal to the population mean IQ score for older siblings. C] The results are statistically signicant at o: = 0.10, so there is sufficient evidence to conclude that the population mean IQ score for younger siblings is lower than the population mean IQ score for older siblings DThe results are statistically insignicant at o: = 0.10, so there is insufficient evidence to conclude that the population mean IQ score for younger siblings is lower than the population mean IQ score for older siblings. g. Interpret the p-value in the context of the study. B If the sample mean IQ score for the 10 younger siblings is the same as the sample mean IQ score for the 10 older siblings and if another 10 sibling pairs are given an IQ test then there would be a 5.62% chance of concluding that the mean IQ score for the 10 younger siblings is at least 3.2 points lower than the mean IQ score for the 10 older siblings. [3 There is a 5.62% chance of a Type I error. [3 If the population mean IQ score for younger siblings is the same as the population mean IQ score for older siblings and if another 10 sibling pairs are given an IQ test then there would be a 5.62% chance that the mean IQ score for the 10 younger siblings would be at least 3.2 points lower than the mean IQ score for the 10 older siblings. DThere is a 5.62% chance that the mean IQ score for the 10 younger siblings is at least 3.2 points lower than the mean IQ score for the 10 older siblings. Chapter 10: Hypothesis Test for Matched Pairs Samples Score: 0/16 0/4 answered Progress saved Done B & Voce . . . . Question 2 0/3 pts '9 3 99 0 Details Is the average time to complete an obstacle course different when a patch is placed over the right eye than when a patch is placed over the left eye? Thirteen randomly selected volunteers first completed an obstacle course with a patch over one eye and then completed an equally difficult obstacle course with a patch over the other eye. The completion times are shown below. "Left" means the patch was placed over the left eye and "Right" means the patch was placed over the right eye. Time to Complete the Course Right 44 42 140 46 49 43 48 50 Left 38 45 36 44 47 39 43 48 Assume a Normal distribution. What can be concluded at the the a = 0.10 level of significance level of significance? For this study, we should use Select an answer a. The null and alternative hypotheses would be: Ho: Select an answer Select an answer Select an answer v (please enter a decimal) H1 : Select an answer Select an answer Y Select an answer (Please enter a decimal) b. The test statistic ? (please show your answer to 3 decimal places.) c. The p-value = (Please show your answer to 4 decimal places.) d. The p-value is (? v a e. Based on this, we should | Select an answer the null hypothesis.\fChapter 10: Hypothesis Test for Matched Pairs Samples Score: 0/16 0/4 answered Progress saved Done B & Voco . . . . Question 1 > 0/3 pts 9 3 99 0 Details Do college students enjoy playing sports less than watching sports? A researcher randomly selected ten college students and asked them to rate playing sports and watching sports on a scale from 1 to 10 with 1 meaning they have no interest and 10 meaning they absolutely love it. The results of the study are shown below. Playing Vs. Watching Sports Play 3 3 3 6 9 4 6 5 2 Watch 3 6 5 6 10 5 5 8 2 Assume a Normal distribution. What can be concluded at the the a = 0.01 level of significance level of significance? For this study, we should use Select an answer a. The null and alternative hypotheses would be: Ho: Select an answer Select an answer Select an answer v (please enter a decimal) H1 : Select an answer Y Select an answer Select an answer v (Please enter a decimal) b. The test statistic (? = (please show your answer to 3 decimal places.) c. The p-value = (Please show your answer to 4 decimal places.) d. The p-value is ? a e. Based on this, we should ( Select an answer |the null hypothesis.Chapter 10: Hypothesis Test for Matched Pairs Samples Score: 0/16 0/4 answered Progress saved Done . . . . Question 3 > 0/5 pts ' 3 99 0 Details On average is the younger sibling's IQ lower than the older sibling's IQ? Ten sibling pairs were given IQ tests. The data are shown below. IQ Scores Younger Sibling 98 80 105 94 116 95 85 96 Older Sibling 107 80 99 92 120 198 82 104 Assume a Normal distribution. What can be concluded at the the a = 0.10 level of significance? For this study, we should use Select an answer a. The null and alternative hypotheses would be: Ho : Select an answer Select an answer Select an answer (please enter a decimal) H1 : Select an answer Select an answer Select an answer (Please enter a decimal) b. The test statistic (? = (please show your answer to 3 decimal places.) c. The p-value = (Please show your answer to 4 decimal places.) d. The p-value is ? a e. Based on this, we should | Select an answer V the null hypothesis