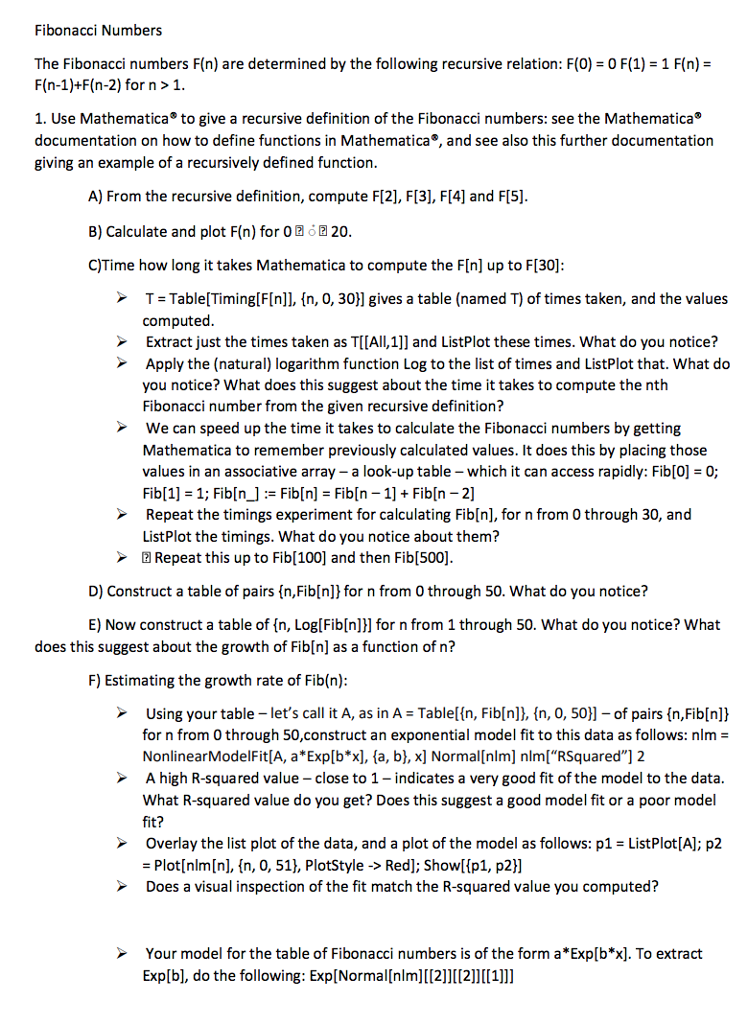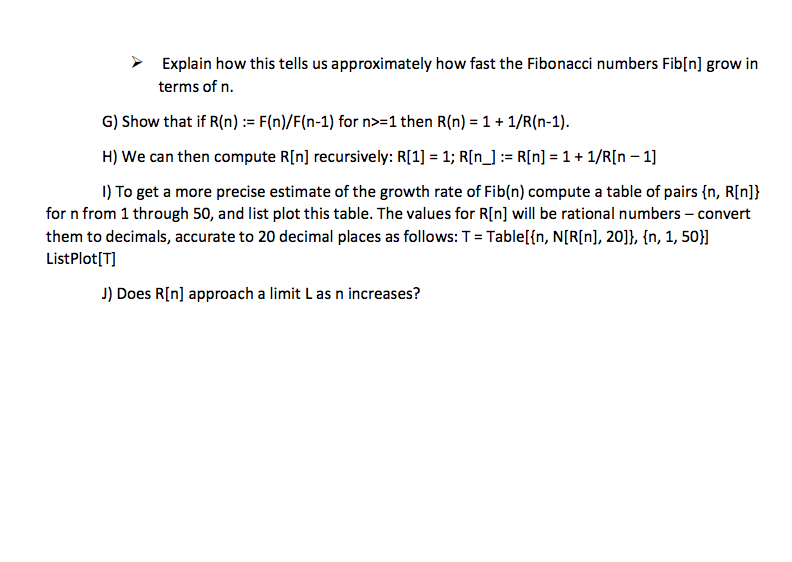

Fibonacci Numbers The Fibonacci numbers F(n) are determined by the following recursive relation: F(0) = 0 F(1)-1 F(n) = F(n-1)+F(n-2) for n>1 1. Use Mathematica to give a recursive definition of the Fibonacci numbers: see the Mathematica documentation on how to define functions in Mathematica", and see also this further documentation giving an example of a recursively defined function A) From the recursive definition, compute F[2], F[3, F[4] and FI5] B) Calculate and plot F(n) for 0 20 C)Time how long it takes Mathematica to compute the FIn] up to F[30] T Table[Timing[F[n]], [n, 0, 30)] gives a table (named T) of times taken, and the values computed Extract just the times taken as TI[All,1]] and ListPlot these times. What do you notice? Apply the (natural) logarithm function Log to the list of times and ListPlot that. What do you notice? What does this suggest about the time it takes to compute the nth Fibonacci number from the given recursive definition? We can speed up the time it takes to calculate the Fibonacci numbers by getting Mathematica to remember previously calculated values. It does this by placing those values in an associative array - a look-up table - which it can access rapidly: Fib[0] 0; Repeat the timings experiment for calculating Fib[n], for n from 0 through 30, and ListPlot the timings. What do you notice about them? Repeat this up to Fib[100] and then Fib[500] D) Construct a table of pairs (n,Fib[nl) for n from 0 through 50. What do you notice? E) Now construct a table of (n, Log[Fib[n] for n from 1 through 50. What do you notice? What does this suggest about the growth of Fib[n] as a function of n? F) Estimating the growth rate of Fib(n) Using your table -let's call it A, as in A Tablelin, Fib[n]), (n, 0, 50)]of pairs (n,Fib[nl) for n from 0 through 50,construct an exponential model fit to this data as follows: nlm- NonlinearModelFit[A, a*Exp[b*x], fa, b), x] Normal [nlm] nlm["RSquared"] 2 A high R-squared value close to 1 - indicates a very good fit of the model to the data What R-squared value do you get? Does this suggest a good model fit or a poor model fit? Overlay the list plot of the data, and a plot of the model as follows: p1-ListPlot[Al; p2 Plot[nlm[n], (n, 0, 51), PlotStyle ->Red]; Showlpl, p21] Does a visual inspection of the fit match the R-squared value you computed? Your model for the table of Fibonacci numbers is of the form a*Exp[b*x). To extract Explb], do the following: Exp[Normal[nlml][[2]J[2]][1]] Fibonacci Numbers The Fibonacci numbers F(n) are determined by the following recursive relation: F(0) = 0 F(1)-1 F(n) = F(n-1)+F(n-2) for n>1 1. Use Mathematica to give a recursive definition of the Fibonacci numbers: see the Mathematica documentation on how to define functions in Mathematica", and see also this further documentation giving an example of a recursively defined function A) From the recursive definition, compute F[2], F[3, F[4] and FI5] B) Calculate and plot F(n) for 0 20 C)Time how long it takes Mathematica to compute the FIn] up to F[30] T Table[Timing[F[n]], [n, 0, 30)] gives a table (named T) of times taken, and the values computed Extract just the times taken as TI[All,1]] and ListPlot these times. What do you notice? Apply the (natural) logarithm function Log to the list of times and ListPlot that. What do you notice? What does this suggest about the time it takes to compute the nth Fibonacci number from the given recursive definition? We can speed up the time it takes to calculate the Fibonacci numbers by getting Mathematica to remember previously calculated values. It does this by placing those values in an associative array - a look-up table - which it can access rapidly: Fib[0] 0; Repeat the timings experiment for calculating Fib[n], for n from 0 through 30, and ListPlot the timings. What do you notice about them? Repeat this up to Fib[100] and then Fib[500] D) Construct a table of pairs (n,Fib[nl) for n from 0 through 50. What do you notice? E) Now construct a table of (n, Log[Fib[n] for n from 1 through 50. What do you notice? What does this suggest about the growth of Fib[n] as a function of n? F) Estimating the growth rate of Fib(n) Using your table -let's call it A, as in A Tablelin, Fib[n]), (n, 0, 50)]of pairs (n,Fib[nl) for n from 0 through 50,construct an exponential model fit to this data as follows: nlm- NonlinearModelFit[A, a*Exp[b*x], fa, b), x] Normal [nlm] nlm["RSquared"] 2 A high R-squared value close to 1 - indicates a very good fit of the model to the data What R-squared value do you get? Does this suggest a good model fit or a poor model fit? Overlay the list plot of the data, and a plot of the model as follows: p1-ListPlot[Al; p2 Plot[nlm[n], (n, 0, 51), PlotStyle ->Red]; Showlpl, p21] Does a visual inspection of the fit match the R-squared value you computed? Your model for the table of Fibonacci numbers is of the form a*Exp[b*x). To extract Explb], do the following: Exp[Normal[nlml][[2]J[2]][1]]


