Answered step by step
Verified Expert Solution
Link Copied!

Question

1 Approved Answer

Fifty students take midterm and final exams. On the midterm exam, the mean score is 45.0 and the standard deviation is 7.00. On the final

Fifty students take midterm and final exams.

On the midterm exam, the mean score is 45.0

and the standard deviation is 7.00. On the final

exam, the mean score is 85.0 with a standard

deviation of 14.00. The correlation coefficient

of the two scores is 0.64.

Obtain the least squares regression line for using the final exam score to predict the midterm

exam score.

47. Fifty students take two midterm exams. On the

first exam, the mean score is 65.0 and the standard deviation is 7.00. On the second exam,

the mean score is 55.0 with a standard deviation of 10.00. The correlation coefficient of the

two scores is 0.70.

Obtain the least squares regression line for using the second exam score to predict the first

exam score.

Homer performs three simulation studies. His

population is skewed to the right. For one study

he has his computer generate 10,000 random

samples of size n = 10 from the population.

For each random sample, the computer calculates the Gosset 95% confidence interval for

and checks to see whether the interval is correct. His second study is like his first, but

n = 100. Finally, his third study is like the first,

but n = 200. In one of his studies, Homer obtains 9,504 correct intervals; in another he obtains 9,478 correct intervals; and in the remaining study he obtains 8,688 correct intervals.

Based on what we learned in class, match each

sample size to its number of correct intervals.

Explain your answer.

40. Independent random samples are selected from

two populations. Below are the sorted data from

the first population.

362 373 399 428 476 481

545 564 585 589 590 600

671 694 723 724 904

Hint: The mean and standard deviation of these

numbers are 571.1 and 144.7.

Below are the sorted data from the second population.

387 530 544 547 646 766

786 864

Hint: The mean and standard deviation of these

numbers are 633.8 and 160.8.

(a) Calculate Gosset's 90% confidence interval for the mean of the first population
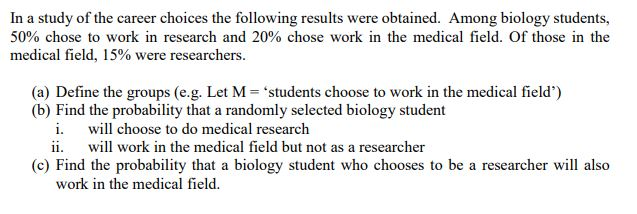
image text in transcribedimage text in transcribedimage text in transcribedimage text in transcribed
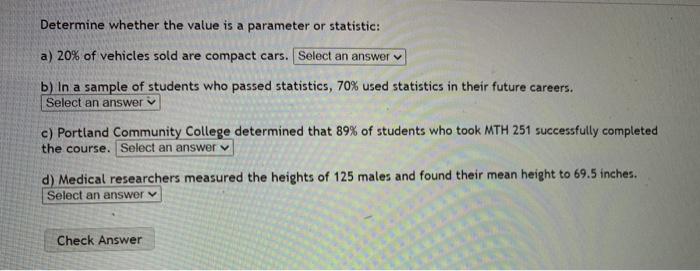
In a study of the career choices the following results were obtained. Among biology students, 50% chose to work in research and 20% chose work in the medical field. Of those in the medical field, 15% were researchers. (a) Define the groups (e.g. Let M = 'students choose to work in the medical field") (b) Find the probability that a randomly selected biology student i. will choose to do medical research ii. will work in the medical field but not as a researcher (c) Find the probability that a biology student who chooses to be a researcher will also work in the medical field.Cholesterol level - Cholesterol level tends to increase with age in both women and men. A medical researcher wants to use statistical inference to determine if average cholesterol level for women over 60 years is lower than men over 60 years. She randomly samples 110 women and 120 men who are over 60 years. The summary statistics are given in the table below in mg/dL. Population/Group Gender Mean cholesterol level Standard deviation Women 196.9 39.8 2 Men 205.4 41.9 The medical researcher uses an appropriate hypothesis test. What is the p-value for this hypothesis test? Give your answer to 4 decimal places. Answer:Determine whether the value is a parameter or statistic: a) 20% of vehicles sold are compact cars. |Select an answer v b) In a sample of students who passed statistics, 70% used statistics in their future careers. Select an answer v c) Portland Community College determined that 89% of students who took MTH 251 successfully completed the course. Select an answer v d) Medical researchers measured the heights of 125 males and found their mean height to 69.5 inches. Select an answer v Check Answer4. A medical researcher says that less than 25% of US adults are smokers. In a random sample of 200 US adults, 18.5% say that they are smokers. At a = 0.05, is there enough evident to reject the researcher's claim? 5. Claim: # = 15; a = 0.01. Sample statistics: x = 13.9, s = 3.23, n = 6. 6. Claim: /a > 0; a = 0.05. Statistics: d = 0.55, sa = 0.99, n = 28. 7. Claim: P, > pz; a = 0.01. Sample Statistics: X, = 6, n, = 20 and X2 = 4, n2 = 30

Step by Step Solution

There are 3 Steps involved in it

Step: 1

blur-text-image

Get Instant Access to Expert-Tailored Solutions

See step-by-step solutions with expert insights and AI powered tools for academic success

Step: 2

blur-text-image_2

Step: 3

blur-text-image_3

Ace Your Homework with AI

Get the answers you need in no time with our AI-driven, step-by-step assistance

Get Started

Recommended Textbook for

Applied Calculus

Authors: Stefan Waner, Steven Costenoble

7th Edition

1337514306, 9781337514309

More Books

Students also viewed these Mathematics questions

Question

$1.34 is what percent of $655?

Answered: 1 week ago