

Answered step by step
Verified Expert Solution
Question
1 Approved Answer
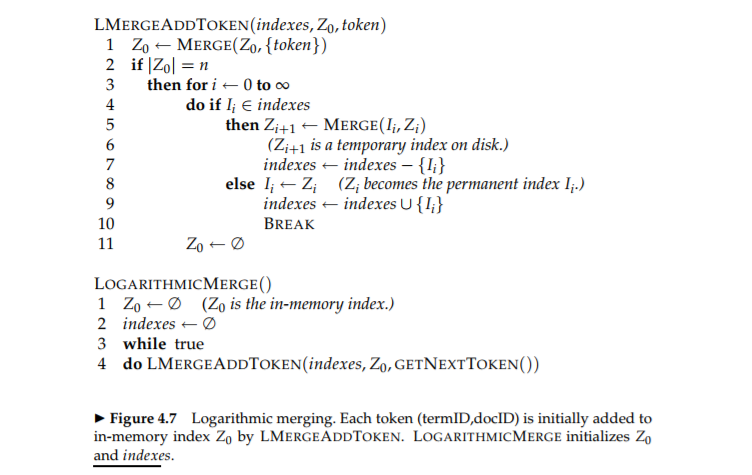
FIG 4.7 IS SHOWN BELOW: E. For n2 and 1 s Ts 30 (where Tis the number of postings), perform a step-by-step simulation of the
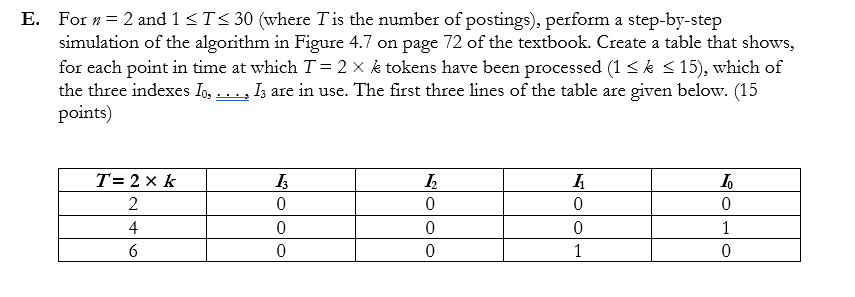
FIG 4.7 IS SHOWN BELOW:
Step by Step Solution
There are 3 Steps involved in it
Step: 1

Get Instant Access to Expert-Tailored Solutions
See step-by-step solutions with expert insights and AI powered tools for academic success
Step: 2

Step: 3
Ace Your Homework with AI
Get the answers you need in no time with our AI-driven, step-by-step assistance
Get Started
Informix Database Administrators Survival Guide
Authors: Joe Lumbley
1st Edition
0131243144, 978-0131243149