Answered step by step
Verified Expert Solution
Question
1 Approved Answer
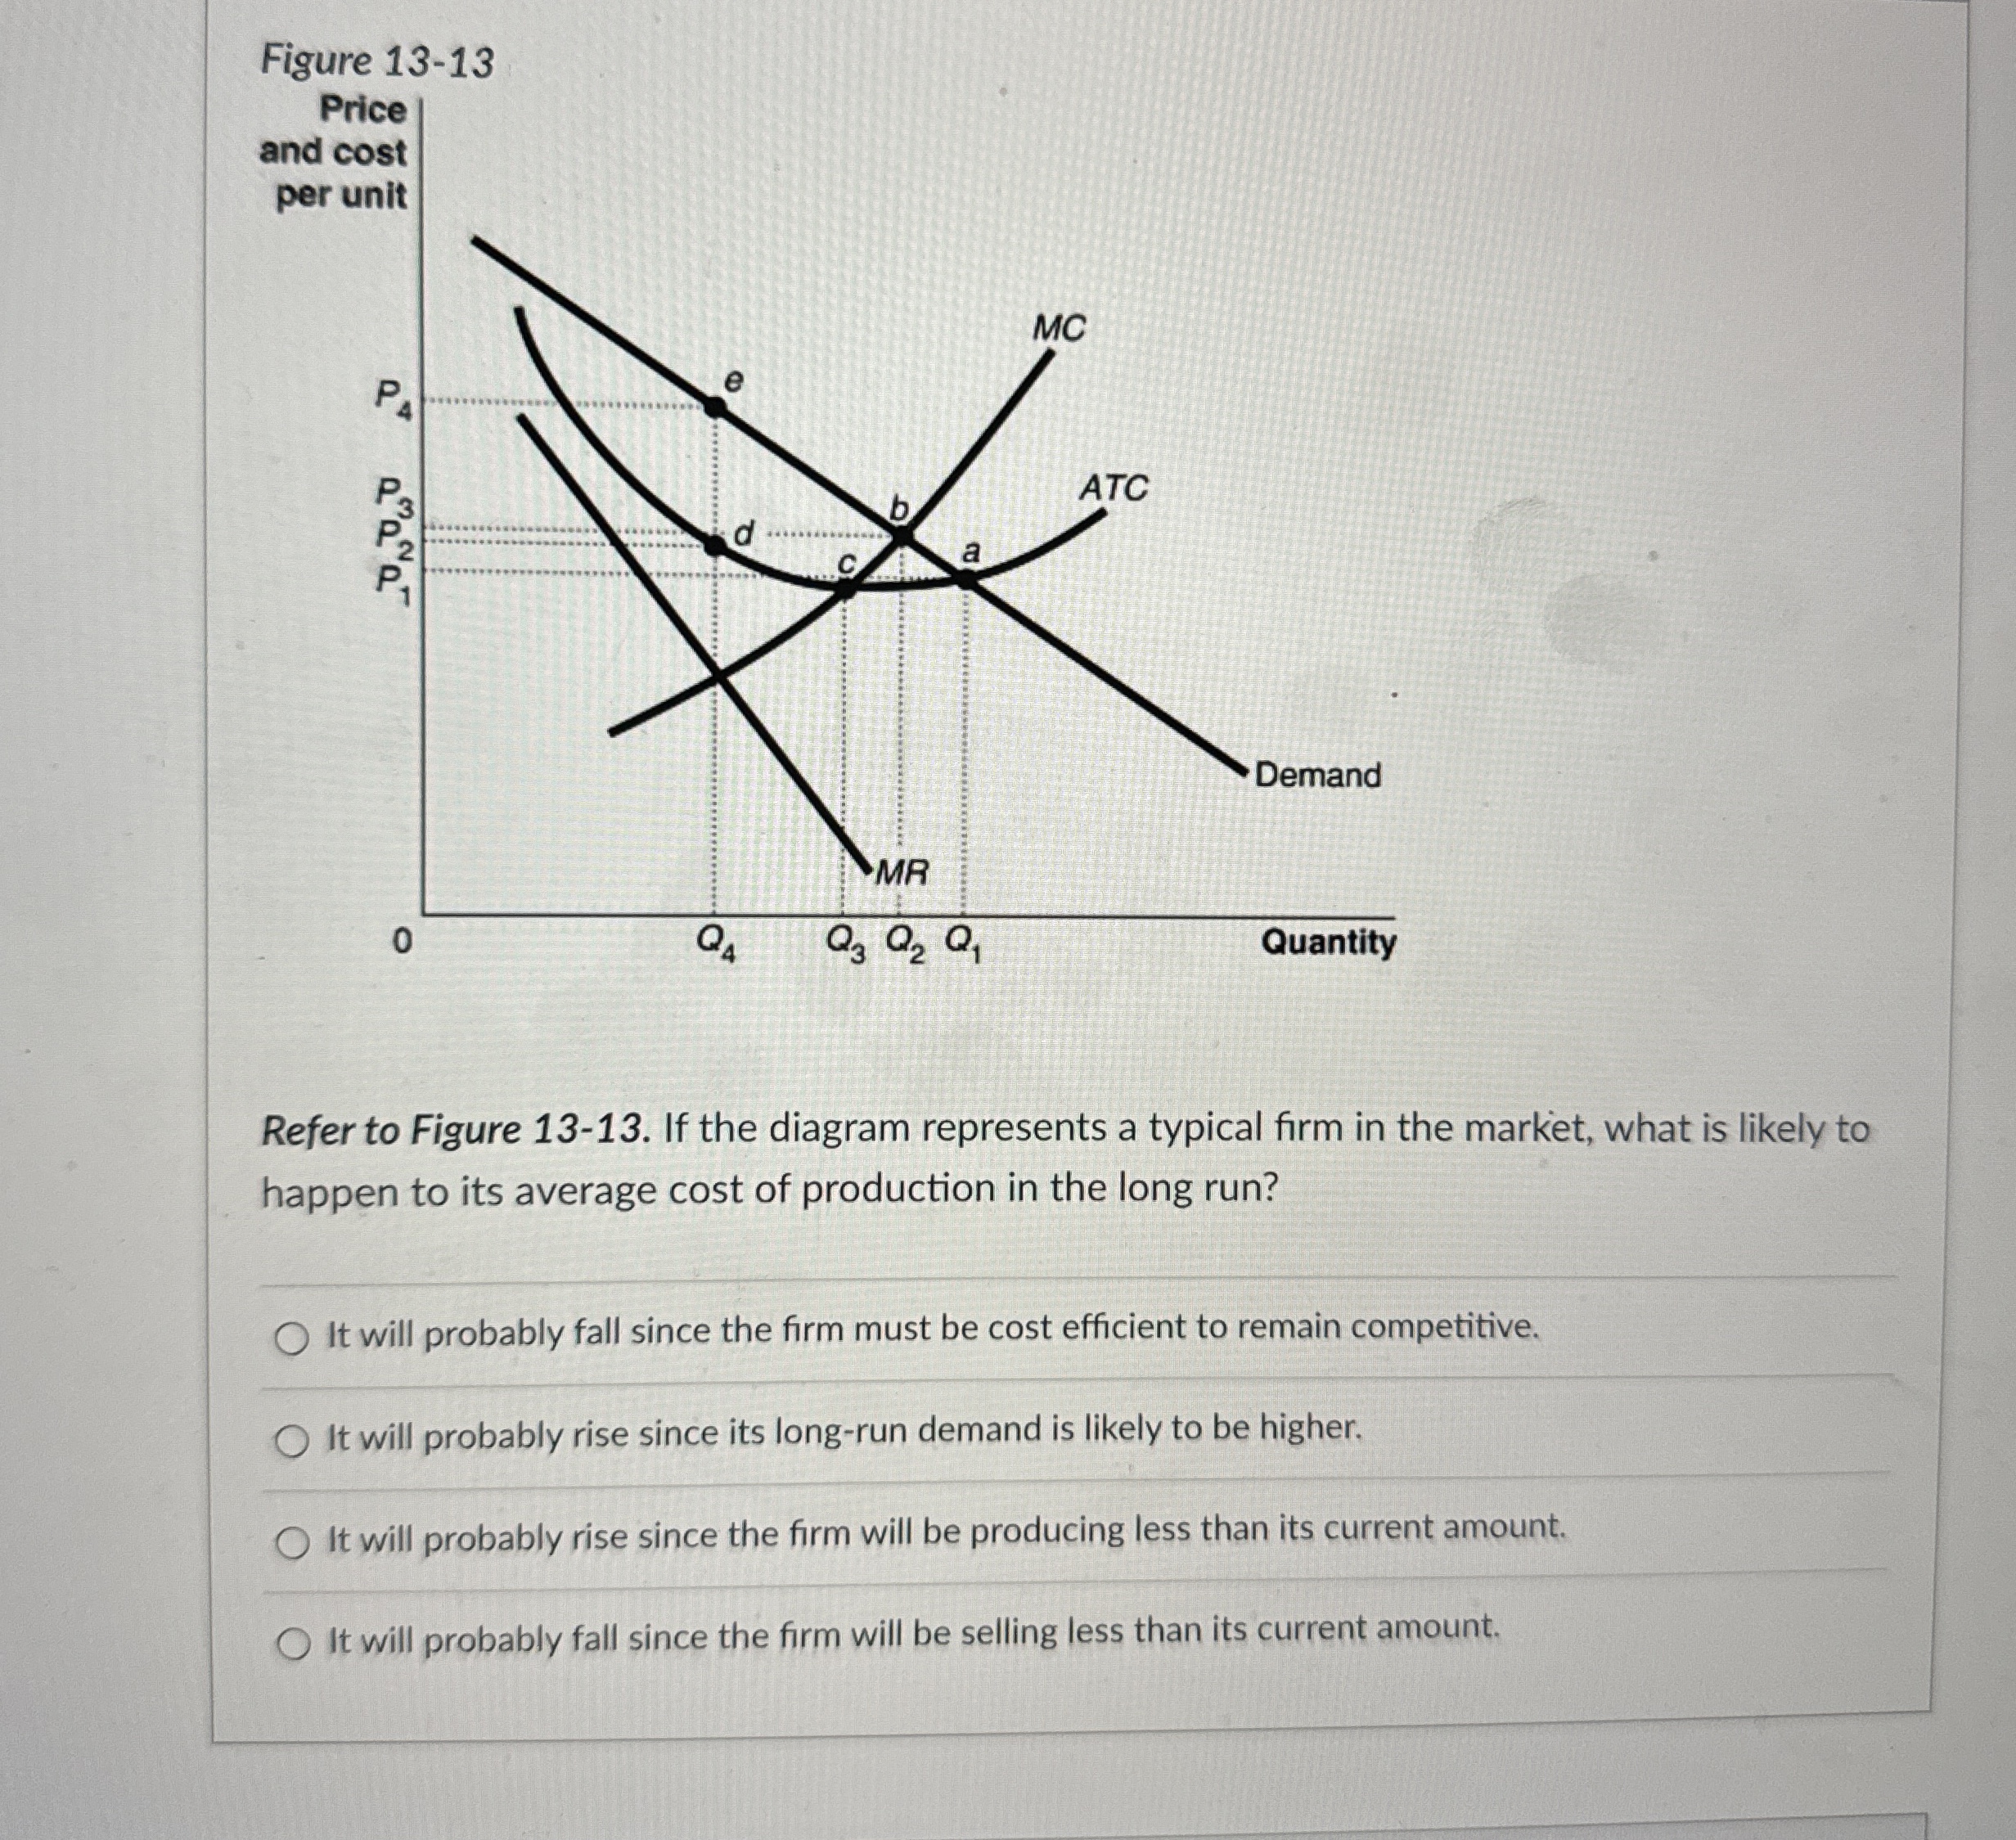
Figure 1 3 - 1 3 Refer to Figure 1 3 - 1 3 . If the diagram represents a typical firm in the market,
Figure
Refer to Figure If the diagram represents a typical firm in the market, what is likely to happen to its average cost of production in the long run?
It will probably fall since the firm must be cost efficient to remain competitive.
It will probably rise since its longrun demand is likely to be higher.
It will probably rise since the firm will be producing less than its current amount.
It will probably fall since the firm will be selling less than its current amount.

Step by Step Solution
There are 3 Steps involved in it
Step: 1

Get Instant Access to Expert-Tailored Solutions
See step-by-step solutions with expert insights and AI powered tools for academic success
Step: 2

Step: 3

Ace Your Homework with AI
Get the answers you need in no time with our AI-driven, step-by-step assistance
Get Started


