

Answered step by step
Verified Expert Solution
Question
1 Approved Answer
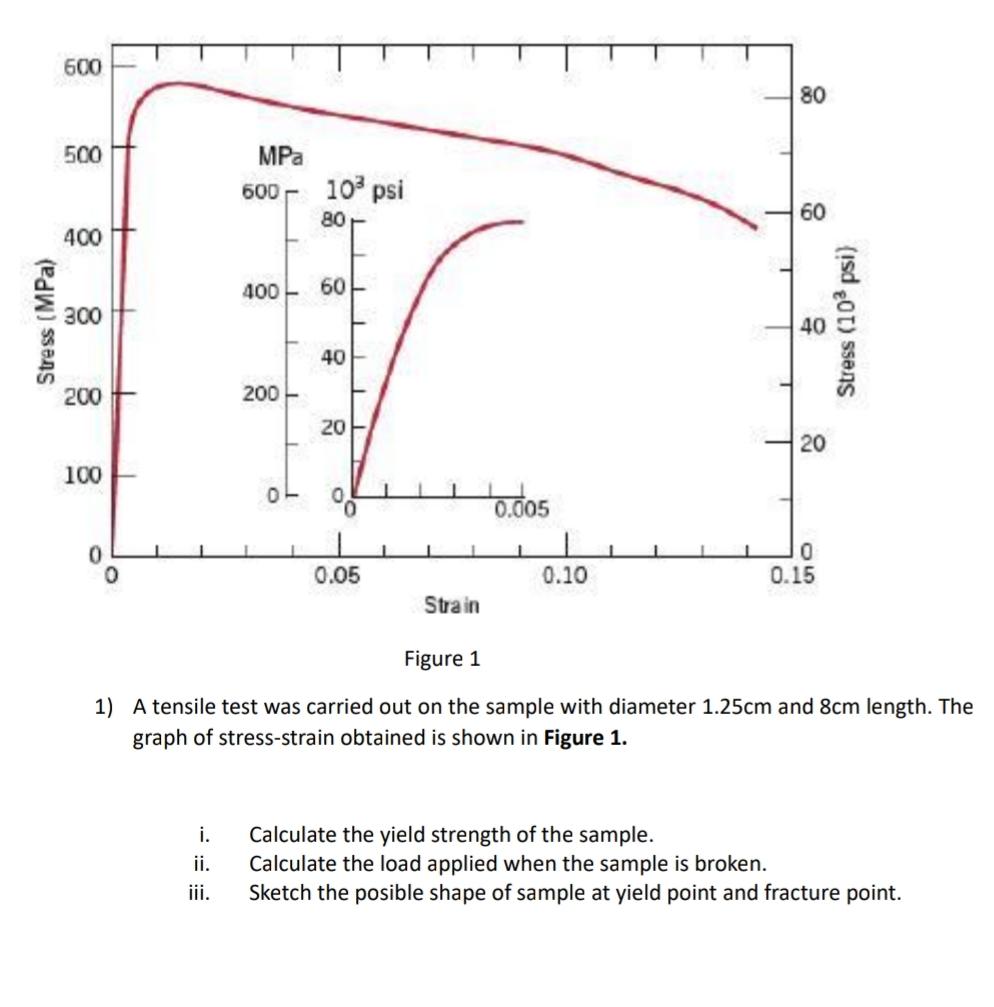
Figure 1 A tensile test was carried out on the sample with diameter 1 . 2 5 c m and 8 c m length. The
Figure
A tensile test was carried out on the sample with diameter and length. The graph of stressstrain obtained is shown in Figure
i Calculate the yield strength of the sample.
ii Calculate the load applied when the sample is broken.
iii. Sketch the posible shape of sample at yield point and fracture point.
Step by Step Solution
There are 3 Steps involved in it
Step: 1

Get Instant Access to Expert-Tailored Solutions
See step-by-step solutions with expert insights and AI powered tools for academic success
Step: 2

Step: 3
Ace Your Homework with AI
Get the answers you need in no time with our AI-driven, step-by-step assistance
Get Started
Modern Quantum Mechanics
Authors: J.J Sakurai
Revised Edition
9781108499996, 201539292, 978-0201539295