Answered step by step
Verified Expert Solution
Question
1 Approved Answer
Figure 1. Parts Moved Between Work Centers begin{tabular}{ccccc} hline & A & B & C & D hline A & - & 480 &
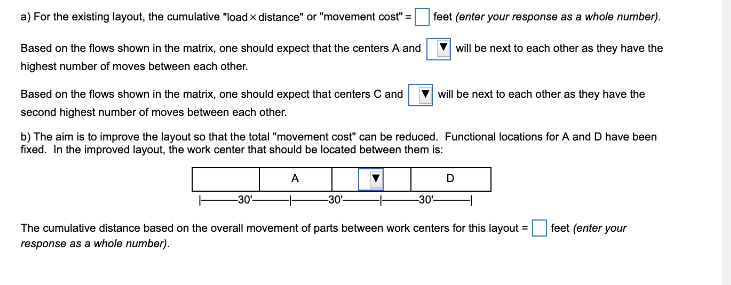
Figure 1. Parts Moved Between Work Centers \begin{tabular}{ccccc} \hline & A & B & C & D \\ \hline A & - & 480 & 600 & 50 \\ B & 350 & - & 225 & 0 \\ C & 0 & 0 & - & 725 \\ D & 0 & 0 & 0 & - \\ \hline \end{tabular} Figure 2. Existing Layout \begin{tabular}{|c|c|c|c|} \hline A & B & C & D \\ \hline W30_30130C \end{tabular} a) For the existing layout, the cumulative "load distance" or "movement cost" = feet (enter your response as a whole number). Based on the flows shown in the matrix, one should expect that the centers A and will be next to each other as they have the highest number of moves between each other. Based on the flows shown in the matrix, one should expect that centers C and will be next to each other as they have the second highest number of moves between each other. b) The aim is to improve the layout so that the total "movement cost" can be reduced. Functional locations for A and D have been fixed. In the improved layout, the work center that should be located between them is: The cumulative distance based on the overall movement of parts between work centers for this layout = feet (enter your response as a whole number)
Step by Step Solution
There are 3 Steps involved in it
Step: 1
Get Instant Access to Expert-Tailored Solutions
See step-by-step solutions with expert insights and AI powered tools for academic success
Step: 2
Step: 3
Ace Your Homework with AI
Get the answers you need in no time with our AI-driven, step-by-step assistance
Get Started