Answered step by step
Verified Expert Solution
Question
1 Approved Answer
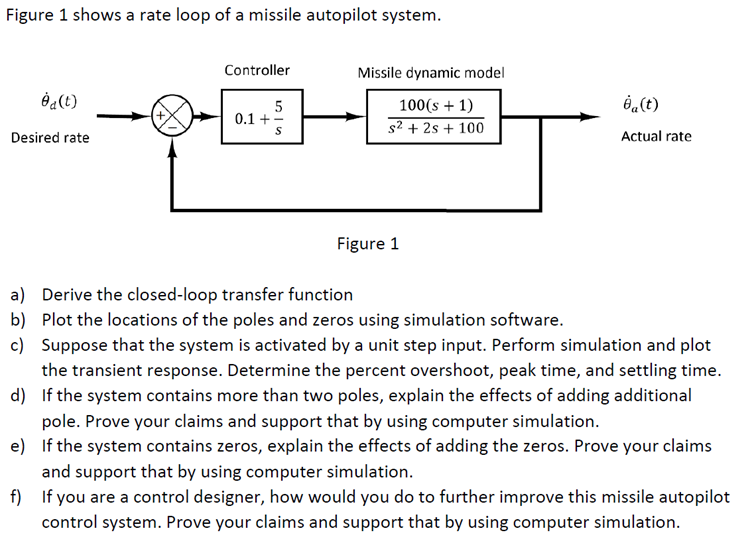
Figure 1 shows a rate loop of a missile autopilot system. Controller d(t) 5 Missile dynamic model 100(s + 1) Ba(t) 0.1 + S


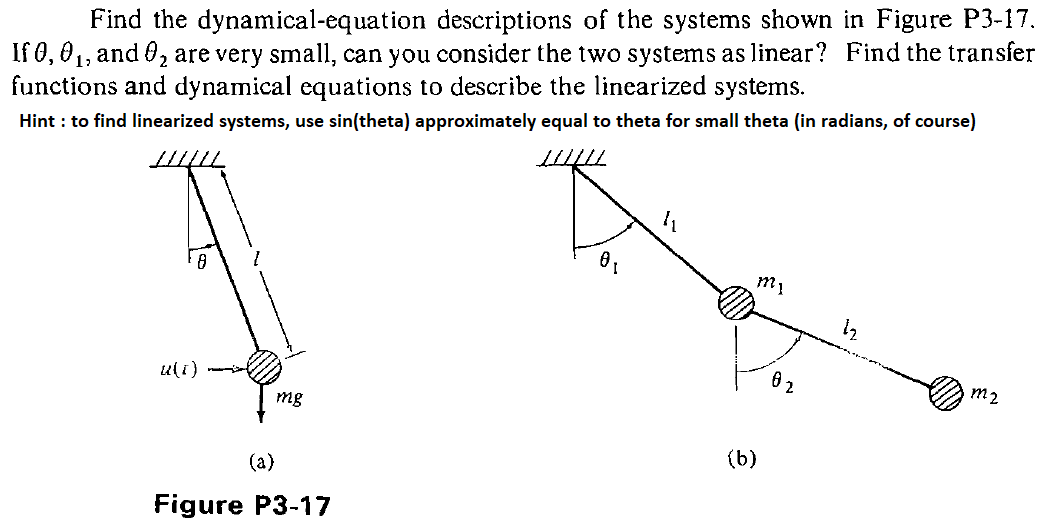
Figure 1 shows a rate loop of a missile autopilot system. Controller d(t) 5 Missile dynamic model 100(s + 1) Ba(t) 0.1 + S s + 2s + 100 Desired rate Actual rate Figure 1 a) Derive the closed-loop transfer function b) Plot the locations of the poles and zeros using simulation software. c) Suppose that the system is activated by a unit step input. Perform simulation and plot the transient response. Determine the percent overshoot, peak time, and settling time. d) If the system contains more than two poles, explain the effects of adding additional pole. Prove your claims and support that by using computer simulation. e) If the system contains zeros, explain the effects of adding the zeros. Prove your claims and support that by using computer simulation. f) If you are a control designer, how would you do to further improve this missile autopilot control system. Prove your claims and support that by using computer simulation. Find the dynamical-equation descriptions of the systems shown in Figure P3-17. If 0,01, and 2 are very small, can you consider the two systems as linear? Find the transfer functions and dynamical equations to describe the linearized systems. Hint: to find linearized systems, use sin(theta) approximately equal to theta for small theta (in radians, of course) 18 u(t) mg (a) Figure P3-17 mi 12 M2 (b)
Step by Step Solution
There are 3 Steps involved in it
Step: 1

Get Instant Access to Expert-Tailored Solutions
See step-by-step solutions with expert insights and AI powered tools for academic success
Step: 2

Step: 3

Ace Your Homework with AI
Get the answers you need in no time with our AI-driven, step-by-step assistance
Get Started


