Answered step by step
Verified Expert Solution
Link Copied!

Question

1 Approved Answer

Figure 1 shows the quarterly exports of Australian national accounts from January 1960 - October 1995. million of dollars 15000 20000 25000 10000 5000 0
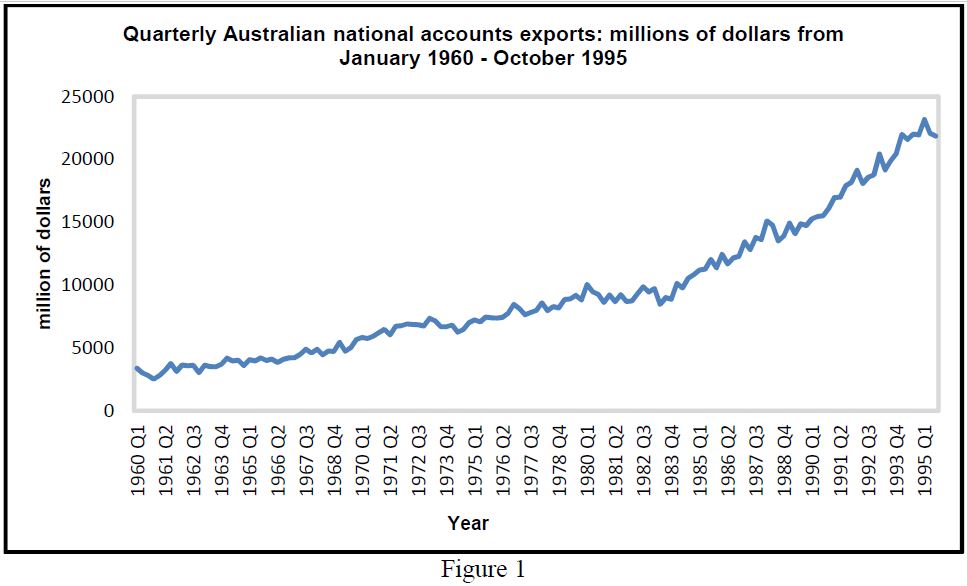
Figure 1 shows the quarterly exports of Australian national accounts from January 1960 -

October 1995.
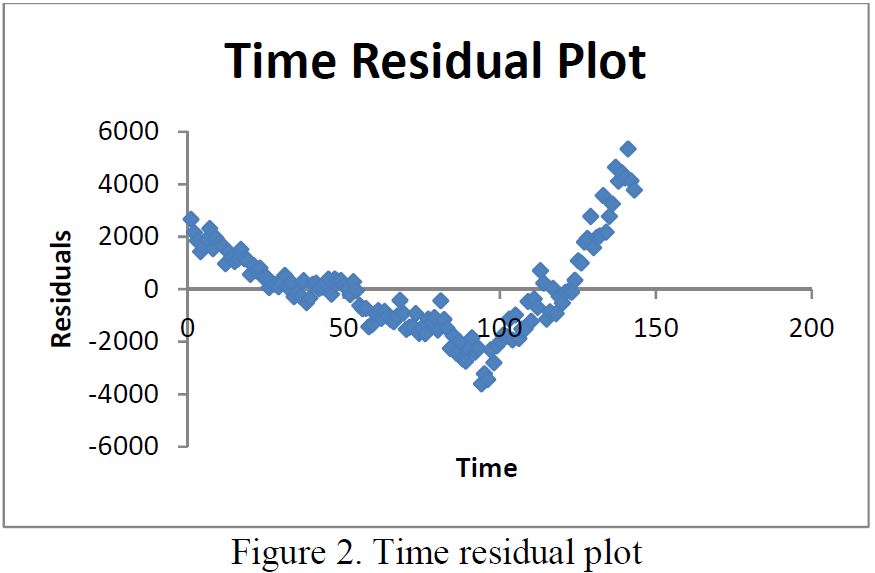
image text in transcribedimage text in transcribed
million of dollars 15000 20000 25000 10000 5000 0 1960 Q1 1961 Q2 1962 Q3 1963 Q4 1965 Q1 1966 Q2 1967 Q3 1968 Q4 1970 Q1 1971 Q2 1972 Q3 1973 Q4 Year 1975 Q1 January 1960 - October 1995 Quarterly Australian national accounts exports: millions of dollars from Figure 1 1976 Q2 1977 Q3 1978 Q4 1980 Q1 1981 Q2 1982 Q3 1983 Q4 1985 Q1 1986 Q2 1987 Q3 1988 Q4 1990 Q1 1991 Q2 1992 Q3 1993 Q4 1995 Q1Time Residual Plot 6000 4000 2000 O Residuals -2000 50 100 150 200 -4000 -6000 Time Figure 2. Time residual plot

Step by Step Solution

There are 3 Steps involved in it

Step: 1

blur-text-image

Get Instant Access to Expert-Tailored Solutions

See step-by-step solutions with expert insights and AI powered tools for academic success

Step: 2

blur-text-image

Step: 3

blur-text-image

Ace Your Homework with AI

Get the answers you need in no time with our AI-driven, step-by-step assistance

Get Started

Recommended Textbook for

Algebra And Trigonometry, Enhanced

Authors: Cynthia Y Young

4th Edition

1119320860, 9781119320869

More Books

Students also viewed these Mathematics questions

Question

What is operatiing system?

Answered: 1 week ago