

Answered step by step
Verified Expert Solution
Question
1 Approved Answer
*Figure 11 is shown below, Provide MATLAB code and screenshots Problem 1 (30 points): Consider the half-wave rectifier circuit in Figure 11. Your goal is
*Figure 11 is shown below, Provide MATLAB code and screenshots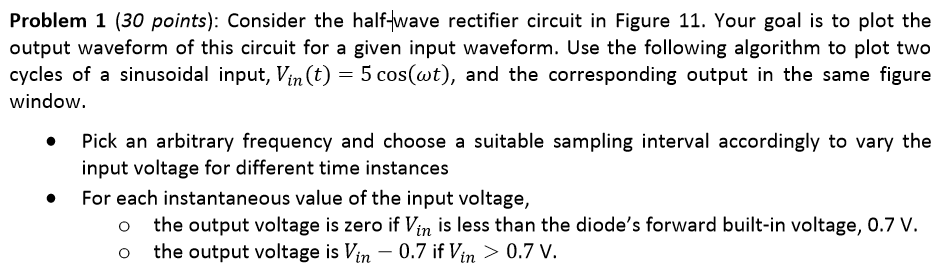
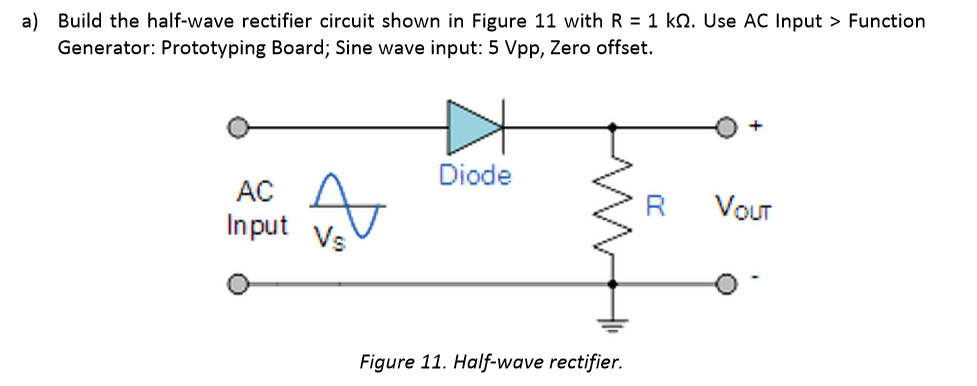
Problem 1 (30 points): Consider the half-wave rectifier circuit in Figure 11. Your goal is to plot the output waveform of this circuit for a given input waveform. Use the following algorithm to plot two cycles of a sinusoidal input, Vin(t) 5 cos(wt), and the corresponding output in the same figure window .Pick an arbitrary frequency and choose a suitable sampling interval accordingly to vary the input voltage for different time instances For each instantaneous value of the input voltage, o the output voltage is zero if Vin is less than the diode's forward built-in voltage, 0.7 V. o the output voltage is Vin 0.7 if Vin >0.7 V
Step by Step Solution
There are 3 Steps involved in it
Step: 1

Get Instant Access to Expert-Tailored Solutions
See step-by-step solutions with expert insights and AI powered tools for academic success
Step: 2

Step: 3
Ace Your Homework with AI
Get the answers you need in no time with our AI-driven, step-by-step assistance
Get Started
Linked Data A Geographic Perspective
Authors: Glen Hart, Catherine Dolbear
1st Edition
1000218910, 9781000218916