

Answered step by step
Verified Expert Solution
Question
1 Approved Answer
Figure 13.3 Dummy Variable Multiple Regression Model to Estimate Per Capita Wool Consumption (Minitab Output) The regression equation is Per Capita Wool Sales = 12.7
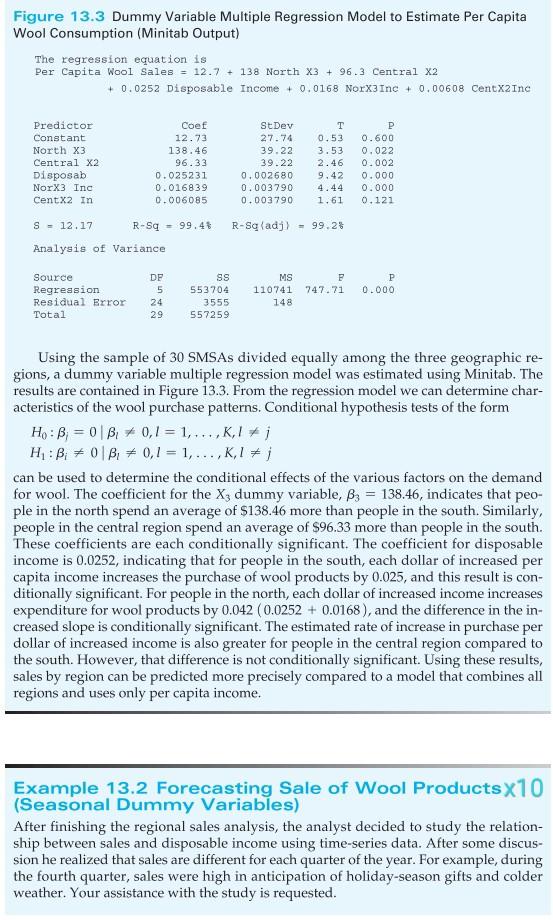
Figure 13.3 Dummy Variable Multiple Regression Model to Estimate Per Capita Wool Consumption (Minitab Output) The regression equation is Per Capita Wool Sales = 12.7 + 138 North X3 + 96.3 Central x2 + 0.0252 Disposable Income + 0.0168 NorX3 Inc +0.00608 CentX2Inc Predictor Constant North x3 Central x2 Disposab NorX3 Inc Centx2 In Coef 12.73 138.46 96.33 0.025231 0.016839 0.006085 St Dev 27.74 39.22 39.22 0.002680 0.003790 0.003790 T 0.53 3.53 2.46 9.42 4.44 1.61 P 0.600 0.022 0.002 0.000 0.000 0.121 S = 12.17 R-S 99.4% R-Sq(adj) = 99.25 Analysis of Variance 747.71 Source Regression Residual Error Total P 0.000 DF 5 24 29 MS 110741 148 SS 553704 3555 557259 Using the sample of 30 SMSAs divided equally among the three geographic re- gions, a dummy variable multiple regression model was estimated using Minitab. The results are contained in Figure 13.3. From the regression model we can determine char- acteristics of the wool purchase patterns. Conditional hypothesis tests of the form Ho: B; = 0 B + 0,1 = 1,...,K1+ i H : B; 7 01 B. + 0,1 = 1,...,K17 j can be used to determine the conditional effects of the various factors on the demand for wool. The coefficient for the X: dummy variable, B3 = 138.46, indicates that peo- ple in the north spend an average of $138.46 more than people in the south. Similarly, people in the central region spend an average of $96.33 more than people in the south. These coefficients are each conditionally significant. The coefficient for disposable income is 0.0252, indicating that for people in the south, each dollar of increased per capita income increases the purchase of wool products by 0.025, and this result is con- ditionally significant. For people in the north, each dollar of increased income increases expenditure for wool products by 0.042 (0.0252 + 0.0168), and the difference in the in- creased slope is conditionally significant. The estimated rate of increase in purchase per dollar of increased income is also greater for people in the central region compared to the south. However, that difference is not conditionally significant. Using these results, sales by region can be predicted more precisely compared to a model that combines all regions and uses only per capita income. Example 13.2 Forecasting Sale of Wool Products x 10 (Seasonal Dummy Variables) After finishing the regional sales analysis, the analyst decided to study the relation- ship between sales and disposable income using time-series data. After some discus- sion he realized that sales are different for each quarter of the year. For example, during the fourth quarter, sales were high in anticipation of holiday-season gifts and colder weather. Your assistance with the study is requested
Step by Step Solution
There are 3 Steps involved in it
Step: 1

Get Instant Access to Expert-Tailored Solutions
See step-by-step solutions with expert insights and AI powered tools for academic success
Step: 2

Step: 3
Ace Your Homework with AI
Get the answers you need in no time with our AI-driven, step-by-step assistance
Get Started
Report Of Audit Resolution Questioned Costs Federal Superfund Program Department Of Health And Environmental Sciences 1994
Authors: Montana Dept Of Health And Environm
1st Edition
101924657X, 978-1019246573