FIGURE 14.1 Futures Prices (November 9, 2015) Futures Contracts | WSJ.com/commodities Metal & Petroleum Futures Contract Open Contract Open High hilo Low Settle Chg Interest
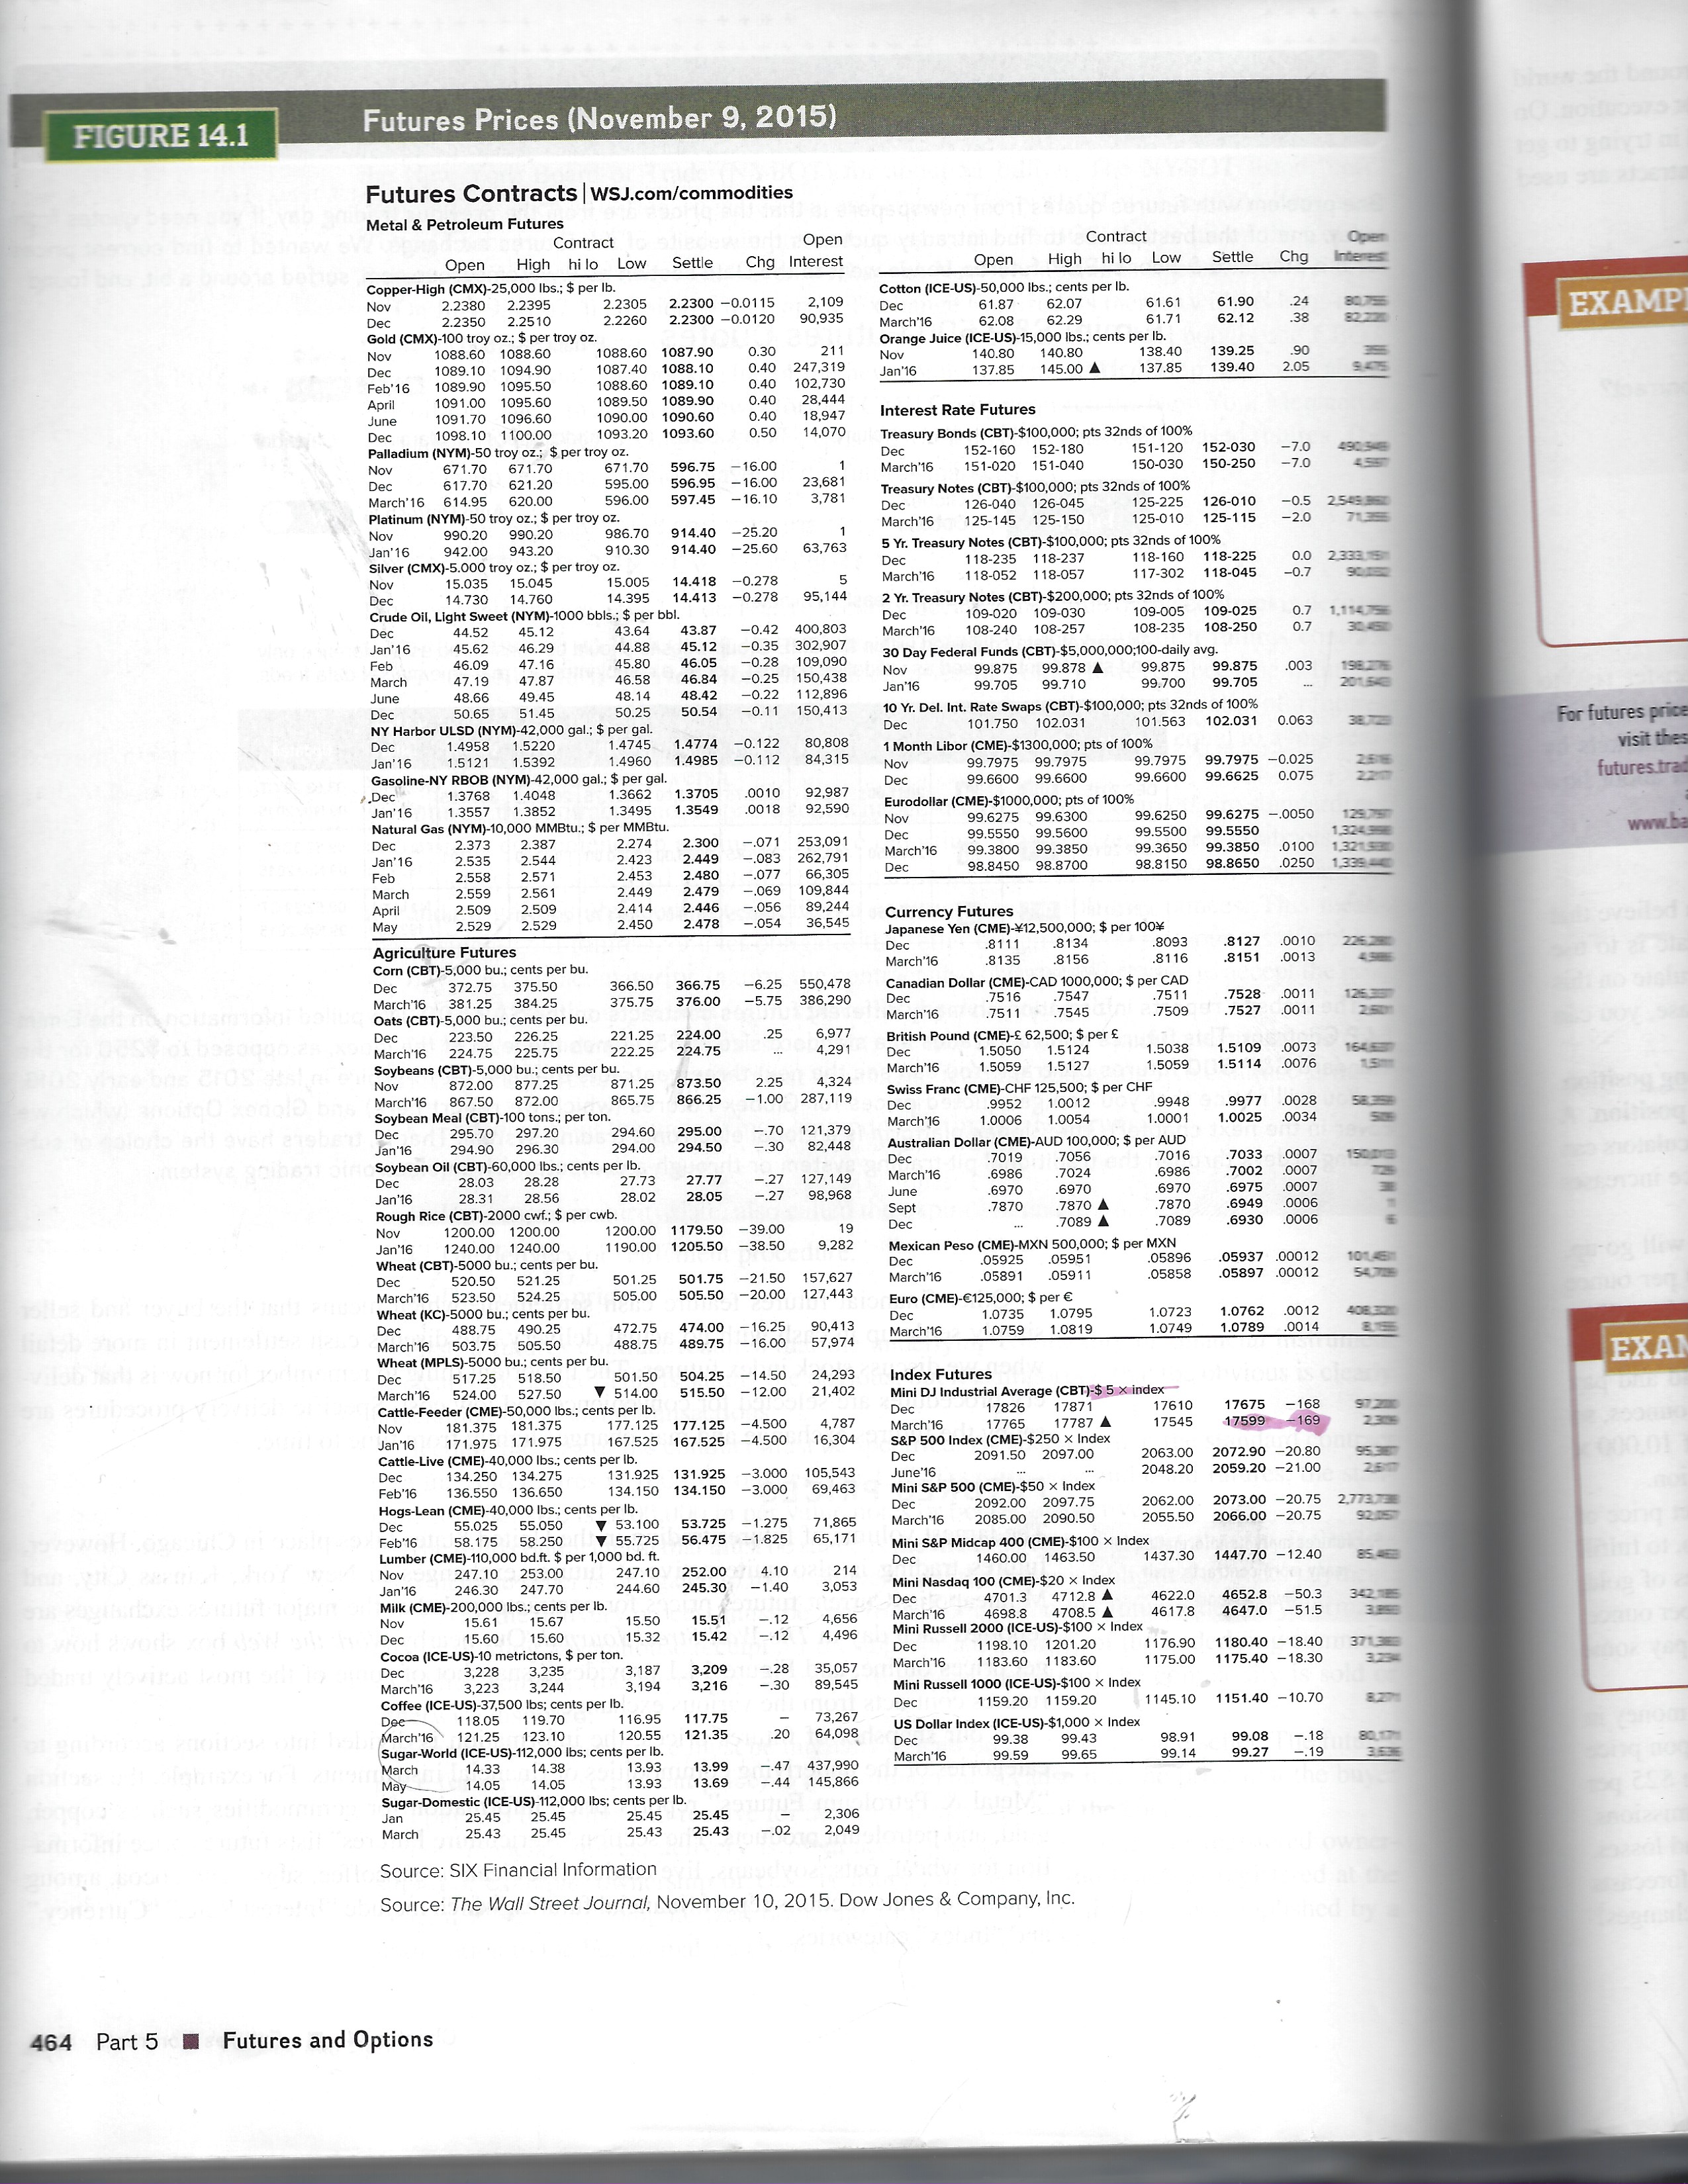
FIGURE 14.1 Futures Prices (November 9, 2015) Futures Contracts | WSJ.com/commodities Metal & Petroleum Futures Contract Open Contract Open High hilo Low Settle Chg Interest Open High hilo Low Settle Chg Copper-High (CMX)-25,000 lbs.; $ per lb. ICE-US)-50,000 lbs.; cents per lb. 2.2380 2.2305 2.2300 -0.0115 2, 109 61.87 62.07 6171 61.90 90.935 62.12 38 EXAMP 2.2260 2.2300 -0.0120 March'16 62.08 62.29 Gold (CMX)-100 troy oz.; $ per troy oz. Orange Juice (ICE-US)-15,000 lbs.; cents per lb. Nov 1089 10 1088.60 1 0.30 130.40 139.25 Dec 0 1094.90 1087.40 1088.10 0.40 247,319 Jan'16 137 85 145.00 137.85 139.40 05 16 1089.90 1095.50 1088.60 10 0.40 102,730 April DO 1095.60 1089.90 28,444 0 1096.60 1090.00 1090.60 0:40 18.947 Interest Rate Futures 1098.10 11 1 100.00 1093.20 1093.60 0.50 14 070 Treasury Bonds (CBT)-$100,000; pts 32nds of 100% Palladium (NYM)-50 tro (Www)-50 troy oz.; $ per troy oz. 152-160 152-180 151-120 152-030 -7.0 Nov 671.70 671.70 596.75 -16.00 March 16 151-040 150-030 150-250 617.70 621.20 595.00 596.95 -16.00 23,681 March'16 614.95 620.00 596.00 597.45 -16.10 3. Treasury Notes (CBT)-$100,000; pts 32nds of 100% Dec 125-225 126-010 March'16 2.0 2509 260 Platinum (NYM)-50 troy oz.; $ per troy oz. 125-145 125 -150 125-010 125-115 Nov 990.20 990.20 986.70 914.40 Jan'16 942.00 910.30 914.40 -25.60 63,763 5 Yr. Treasury Notes (CBT)-$100,000; pts 32nds of 100% Silver (CMX)-5.000 troy oz.; $ per troy 2505 Dec 118-235 118-237 118-160 118-225 Nov 15.045 14.418 117-302 118-045 -0.7 2332. 5m 15.035 -0.278 March 16 118-052 118-057 14.730 14.760 14.395 14.413 -0.278 95,144 2 Yr. Treasury Notes (CBT)-$200,000; pts 32nds of 100% Crude Oil, Light Sweet (NYM)-1000 bbls.; $ per bbl. Dec 109-020 109-030 109-025 0.7 1.135 44.52 45.12 43.64 43.87 -0.42 400,803 March'16 108-240 108-257 108-235 108 -250 Jan'16 45.62 45.12 Feb 46.09 46.05 -028 109,090 30 Day Federal Funds (CBT)-$5,000,000;100-daily avg. March 47 .19 46.58 46.84 -0.25 003 150,438 Nov 99.875 99.878 A 99.875 99.875 49.45 18 14 48.42 -0.22 112,896 Jan'16 99.705 99.710 99.700 99.705 20150 June 50.65 51 45 50.25 50.54 -0.11 150,413 10 Yr. Del. Int. Rate Swaps (CBT)-$100,000; pts 32nds of 100% NY Harbor ULSD (NYM)-42,000 gal.; $ per gal. 101.750 102.031 101.563 102.031 0.063 For futures pric Dec 1.4745 1.4774 80,80 visit the Jan . 16 1.5121 1.5392 4960 1.4985 -0.112 84.315 1 Month Libor (CME)-$1300,000; pts of 100%_ 09.7975 99.7975 99.7975 99.7975 -0.025 Gasoline-NY RBOB (NYM)-42,000 gal.; $ per gal. 9.6600 99.6600 99.6600 99.6625 0.075 futures.tra .Dec 1.4048 1.3705 0010 92,98 1.3852 1.3495 1.3549 0018 92,590 Eurodollar (CME)-$1000,000; pts of 100% Jan' 16 Natural Gas (NYM)-10,000 MMBtu.; $ per MMBtu. 99.6275 99.6300 99.6250 -.0050 123 257 www.b 2.373 2.387 2.274 99.5600 99.5500 Jan'1 2.535 2.544 2.423 2.449 -1083 253,091 262,79 March'16 9.3800 99.3850 9.3650 99.3850 .0100 98 8450 98.8700 98.8150 98.8650 2.558 March 2559 2.571 2:479 -.077 - 069 109 844 April 2:509 2:509 2.414 3:446 89,244 May 2.529 2.529 2450 2.478 -1054 6.545 Currency Futures Agriculture Futures 8111 Japanese Yen (CME)-12,500,000; $ per 100* 8134' 8093 8127 March'16 8135 .8156 .8116 .8151 10013 Corn (CBT)-5,000 bu.; cents per bu. 372.75 375.50 38 25 366.50 66.75 -6.25 550,478 Canadian Dollar (CME)-CAD 1000,000; $ per CAD March'16 381.25 375.75 376.00 386,290 .7516 7511 .7528 -0011 March'16 7541 Oats (CBT)-5,000 bu.; cents per bu. .7509 .7527 . 0011 Dec 223.50 226.25 21.25 6,977 British Pound (CME)-E 62,500; $ per E March 16 224.75 225.18 222.25 224.75 1.5050 Soybeans (CBT)-5,000 bu.; -51-2,000 bu.; cents per bu. March'16 15137 1.5038 1.5109 .0073 1 6059 .5059 .0076 Nov 871.25 873.50 2.25 4.324 March'16 867.50 8 872.00 865.75 866.25 287,119 Swiss Franc (CME)-CHF 125,500; $ per CHF Dec .9952 19006 .9948 .9977 .0028 Soybean Meal (CBT)-100 tons.; per ton. March'16 1.0054 1.000 1.0025 0034 Dec 195.70 297.20 294.60 295.00 .70 121 ,37 Jan'16 296.30 294.00 294.50 30 82.448 Australian Dollar (CME)-AUD 100,000; $ per AUD 0,000 lbs.; cents per lb. Dec .7016 .7033 .0007 28.03 28.28 27.7 27 7,149 March'16 .7002 0007 6970 6970 6970 .0007 Jan'16 28.31 28 02 28.05 27 98,968 .6975 7870 7870 7870 .6949 .0006 Rough Rice (CBT)-2000 cwf.; $ per cwb. 0006 Nov 1200.00 1200.00 1200.00 1179.50 -39.00 Dec .7089 .7089 .6930 19 Jan'16 1240.0 190.00 1205.50 38.50 9,282 Mexican Peso (CME)-MXN 500,000; $ per MXN .05951 Wheat (CBT)-5000 bu.; cents per bu. Dec .05896 .05937 .00012 520.50 521.25 501.25 501.75 21.50 157,627 March'16 .05891 .05911 .05858 05897 .00012 March'16 523.50 05.00 505.50 127.443 Wheat (KC)-5000 bu.; cents per bu. Euro (CME)-125,000; $ Per5 1.0723 1.0762 Dec 488.75 490.25 Dec 1.0735 472.75 474.00 16.25 90,413 March'16 10759 1.0819 1.0749 1.0789 .0014 March'16 503.75 505.50 488.75 489.75 16.00 57,974 EXA Wheat (MPLS)-5000 bu.; cents per bu. Der 517.25 518.50 501.50 504.25 -14.50 24,293 Index Futures March'16 524.00 527.50 514.00 515.50 - 12.00 21.402 Mini DJ Industrial Average (CBT)-$ 5 x index der (CME)-50,000 lbs.; cents per lb. Cattle-Feeder (CME)- Dec 17026 17871 17610 17675 -168 181.375 181.375 177 .125 177.125 -4.500 4,787 17545 17599 -169 130'16 171.975 167.525 1 March'16 7.525 -4.500 S&P 500 Index (CME)-$250 x Index Cattle-Live (CME)-40,000 lbs.; cents per 1b. Dec 2091.50 2097.00 063.00 2072.90 -20.80 Dec 134.250 134.275 131.925 131.925 -3.000 105,543 June 16 2048.20 2059.20 -21.00 Feb '16 136.550 136.650 -3.000 69.463 Dec Mini S&P 500 (CME)-$50 X Index Hogs-Lean (CME)-40,000 lbs.; cents per lb. 2092.00 20 2062.00 2073.00 -20.75 15 253.10 53.72 1.275 71,865 March'16 2085.00 2090.50 2055.50 2066.00 -20.75 55.025 55.050 9215 58.250 55.725 56.475 -1.825 65,171 Mini S&P Midcap 400 (CME)-$100 x Index Lumber (CME)-110,000 bd.ft. $ per 1,000 1460.00 1463.50 1437.30 1447.70 -12.40 Nov 247.10 253.00 247.10 252.00 Jan'16 246.30 247.70 244.60 245.30 1 40 3 053 Mini Nasdaq 100 (CME)-$20 x Index 4712.8 A 4622.0 4652.8 -50.3 Milk (CME)-200,000 lbs.; cents per lb. March'16 60 4708 5 342 # 4617.8 4647.0 -51.5 Nov 15.67 15.50 15.51 Dec 15 60 4,656 15.32 15.42 12 4,496 Mini Russell 2000 (ICE-US)-$100 x Index 1198.10 1201.20 1176.90 1180.40 -18.40 Cocoa (ICE-US)-10 metrictons, $ per ton. 3,228 3,187 35,057 March 16 1183.60 1183.60 175.00 1175.40 -18.30 3,209 March'16 3,223 3,244 3,194 3,216 ,30 89 545 Mini Russell 1000 (ICE-US)-$100 x Index Coffee (ICE-US)-37,500 lbs; cents per lb. Dec 1159.20 1159.20 1145.10 1151.40 -10.70 118.05 119.70 123 10 116.95 17.7 73,267 US Dollar Index (ICE-US)-$1,000 X Index March'16 121.25 20.55 121.35 20 64,090 Dec 99.43 99.08 Sugar-World (ICE-US)-112,000 lbs; cents per lb. larch'16 99.59 99.65 98.91 99.27 March 14.33 214 38 13.93 13.99 May 14.05 13.93 13.69 25.45 Sugar-Domestic (ICE-US)-112,000 lbs; cents per lb. Jan 25.45 25.45 2,306 March 25.43 25.45 25.43 -.02 2,049 Source: SIX Financial Information Source: The Wall Street Journal, November 10, 2015. Dow Jones & Company, Inc. 464 Part 5 . Futures and Options
Step by Step Solution
There are 3 Steps involved in it
Step: 1
Get Instant Access to Expert-Tailored Solutions
See step-by-step solutions with expert insights and AI powered tools for academic success
Step: 2
Step: 3
Ace Your Homework with AI
Get the answers you need in no time with our AI-driven, step-by-step assistance