Question
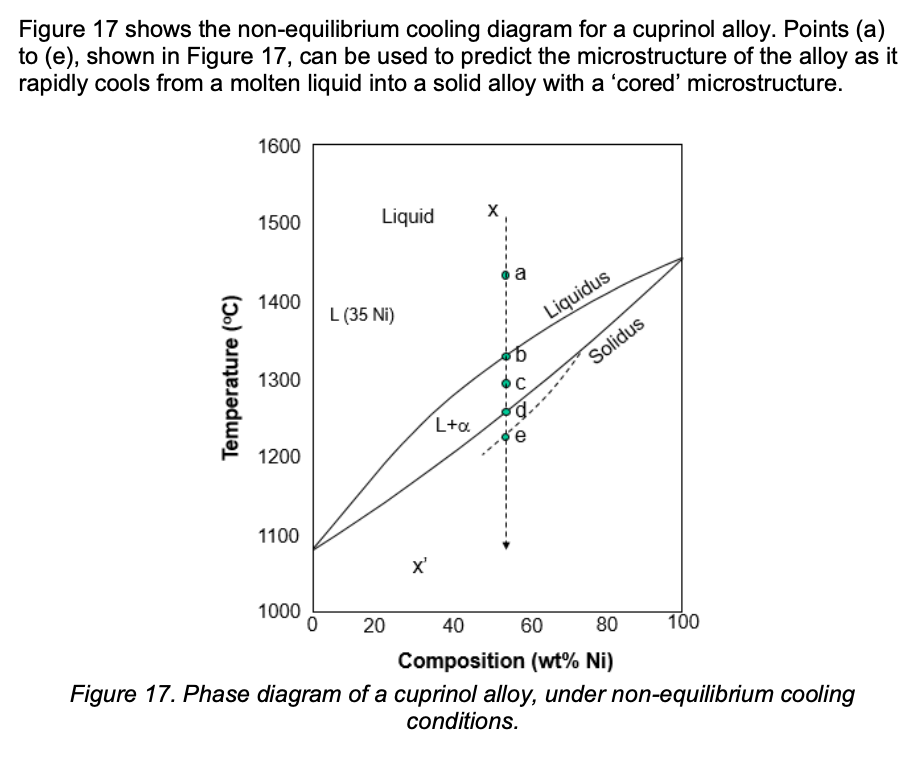
Figure 17 shows the non-equilibrium cooling diagram for a cuprinol alloy. Points (a) to (e), shown in Figure 17, can be used to predict


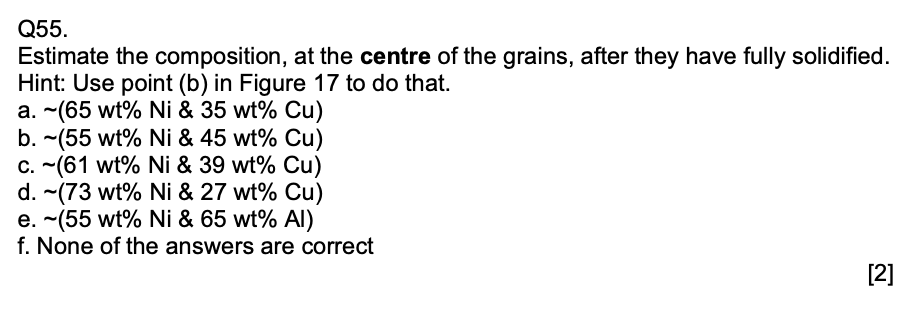
Figure 17 shows the non-equilibrium cooling diagram for a cuprinol alloy. Points (a) to (e), shown in Figure 17, can be used to predict the microstructure of the alloy as it rapidly cools from a molten liquid into a solid alloy with a 'cored' microstructure. 1600 Temperature (C) 1500 Liquid 1400 L (35 Ni) a Liquidus 1300 L+ 1200 Solidus 1100 X' 1000 0 20 40 60 80 100 Composition (wt% Ni) Figure 17. Phase diagram of a cuprinol alloy, under non-equilibrium cooling conditions. Q55. Estimate the composition, at the centre of the grains, after they have fully solidified. Hint: Use point (b) in Figure 17 to do that. a. (65 wt% Ni & 35 wt% Cu) b. ~(55 wt% Ni & 45 wt% Cu) c. (61 wt% Ni & 39 wt% Cu) d. ~(73 wt% Ni & 27 wt% Cu) e. ~(55 wt% Ni & 65 wt% Al) f. None of the answers are correct [2]
Step by Step Solution
There are 3 Steps involved in it
Step: 1

Get Instant Access to Expert-Tailored Solutions
See step-by-step solutions with expert insights and AI powered tools for academic success
Step: 2

Step: 3

Ace Your Homework with AI
Get the answers you need in no time with our AI-driven, step-by-step assistance
Get StartedRecommended Textbook for
Income Tax Fundamentals 2013
Authors: Gerald E. Whittenburg, Martha Altus Buller, Steven L Gill
31st Edition
1111972516, 978-1285586618, 1285586611, 978-1285613109, 978-1111972516
Students also viewed these Mechanical Engineering questions
Question
Answered: 1 week ago
Question
Answered: 1 week ago
Question
Answered: 1 week ago
Question
Answered: 1 week ago
Question
Answered: 1 week ago
Question
Answered: 1 week ago
Question
Answered: 1 week ago
Question
Answered: 1 week ago
Question
Answered: 1 week ago
Question
Answered: 1 week ago
Question
Answered: 1 week ago
Question
Answered: 1 week ago
Question
Answered: 1 week ago
Question
Answered: 1 week ago
Question
Answered: 1 week ago
Question
Answered: 1 week ago
Question
Answered: 1 week ago
Question
Answered: 1 week ago
Question
Answered: 1 week ago
Question
Answered: 1 week ago
Question
Answered: 1 week ago
Question
Answered: 1 week ago
View Answer in SolutionInn App


