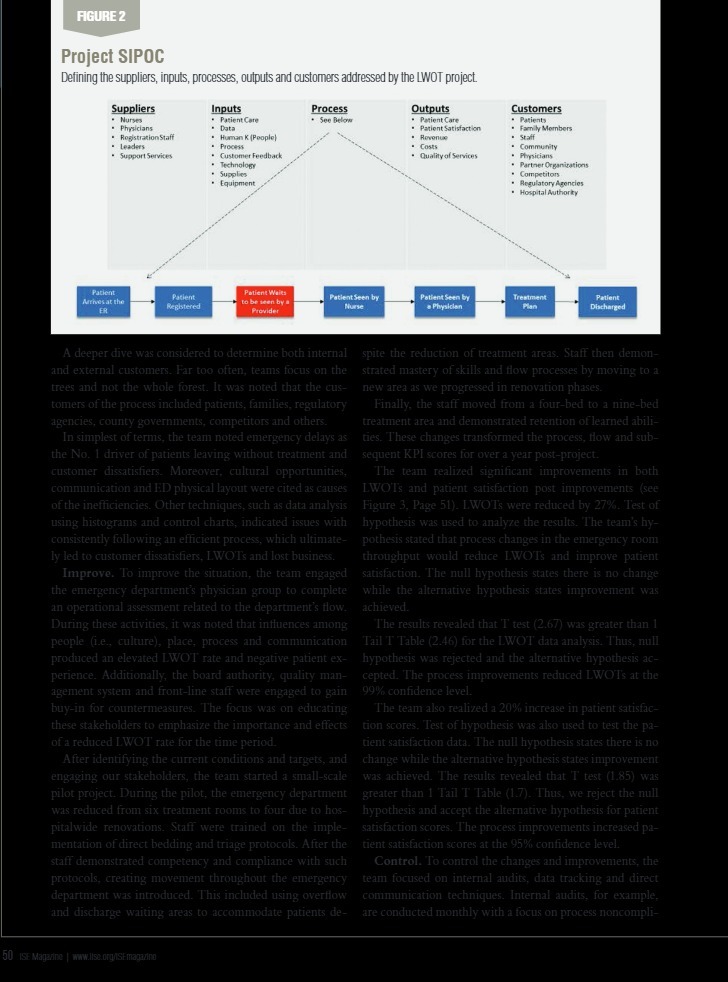
FIGURE 2 Project SIPOC Defining the suppliers, inputs, processes, outputs and customers addressed by the LWOT project. Suppliers Inputs Process Outputs Customers " Nurses " Patient Care . See Below * Patient Care Patients Physicians Data - Patient Satisfaction Family Members Rogistration Staff " Human K (People) Revenue Staff Leaders - Costs . Communin . Support Services " Customer Feedback Quality of Services . Physicians . Technolog Partner Organizations . Supplies . Competitors . Equipment Regulatory Agencies . Hospital Authority Patient Patient Patient Waits Mriver at the to be seen by a Patient Seen by Patient Seen by Treatment Patient ER Reghtered Provider Nurse Physician Discharged A deeper dive was considered to determine both internal spite the reduction of treatment areas. Staff then demon- and external customers. Far too often, teams focus on the strated mastery of skills and flow processes by moving to a trees and not the whole forest. It was noted that the cus- new area as we progressed in renovation phases. tomers of the process included patients, families, regulatory Finally, the staff moved from a four-bed to a nine-bed agencies, county governments, competitors and others. treatment area and demonstrated retention of learned abili- In simplest of terms, the team noted emergency delays as ties. These changes transformed the process, flow and sub- the No. I driver of patients leaving without treatment and sequent KPI scores for over a year post-project. customer dissatisfiers. Moreover, cultural opportunities, The team realized significant improvements in both communication and ED physical layout were cited as causes LWOT's and patient satisfaction post improvements (see of the inefficiencies. Other techniques, such as data analysis Figure 3, Page 51). LWOTs were reduced by 27%. Test of using histograms and control charts, indicated issues with hypothesis was used to analyze the results. The team's by- consistently following an efficient process, which ultimate- pothesis stated that process changes in the emergency room ly led to customer dissatisfiers, LWOTs and lost business. throughput would reduce LWOTs and improve patient Improve. To improve the situation, the team engaged satisfaction. The null hypothesis states there is no change the emergency department's physician group to complete while the alternative hypothesis states improvement was an operational assessment related to the department's flow. achieved. During these activities, it was noted that influences among The results revealed that T test (2.67) was greater than 1 people (i.e., culture), place, process and communication Tail T Table (2.46) for the LWOT data analysis. Thus, null produced an elevated LWOT rate and negative patient ex- hypothesis was rejected and the alternative hypothesis ac- perience. Additionally, the board authority, quality man- cepted. The process improvements reduced LWOTs at the agement system and front-line staff were engaged to gain 99% confidence level. buy-in for countermeasures. The focus was on educating The team also realized a 20% increase in patient satisfac these stakeholders to emphasize the importance and effects tion scores. Test of hypothesis was also used to test the pa- of a reduced L.WOT rate for the time period. tient satisfaction data. The null hypothesis states there is no After identifying the current conditions and targets, and change while the alternative hypothesis states improvement engaging our stakeholders, the team started a small-scale was achieved. The results revealed that T test (1.85) was pilot project. During the pilot, the emergency department greater than 1 Tail T Table (1.7). Thus, we reject the null was reduced from six treatment rooms to four due to hos- hypothesis and accept the alternative hypothesis for patient pitalwide renovations. Staff were trained on the imple- satisfaction scores. The process improvements increased pa- mentation of direct bedding and triage protocols. After the tient satisfaction scores at the 95% confidence level. staff demonstrated competency and compliance with such Control. To control the changes and improvements, the protocols, creating movement throughout the emergency team focused on internal audits, data tracking and direct department was introduced. This included using overflow communication techniques. Internal audits, for example, and discharge waiting areas to accommodate patients de- are conducted monthly with a focus on process noncompli- 50 ISE Magazine | www.lise.org/SE magazine