

Answered step by step
Verified Expert Solution
Question
1 Approved Answer
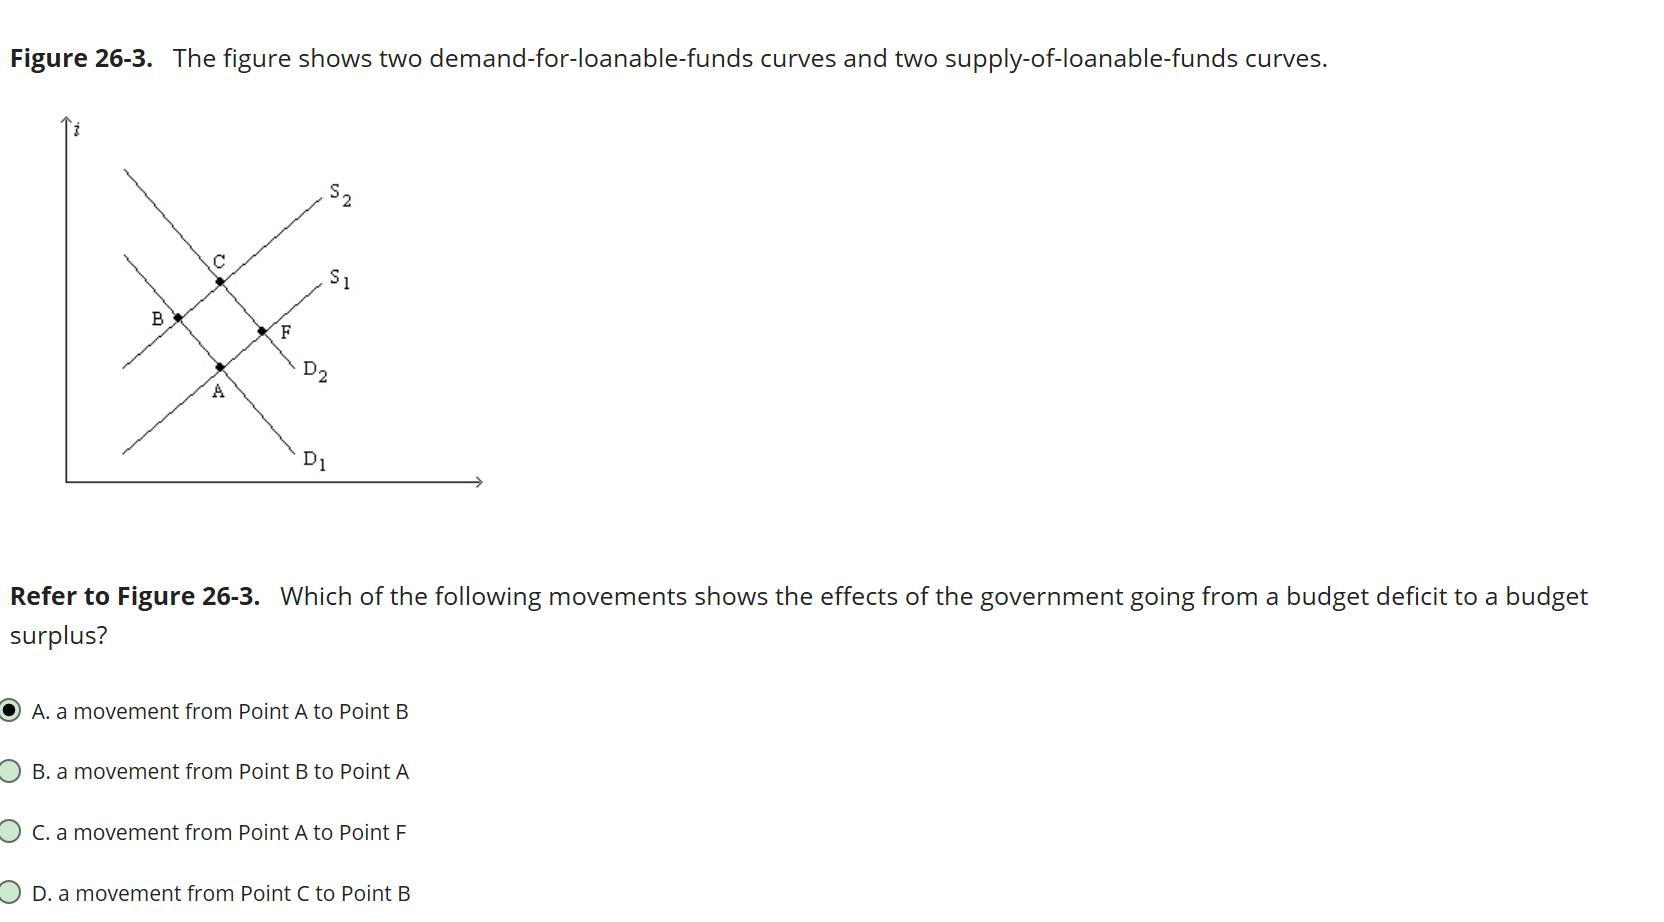
Figure 26-3. The figure shows two demand-for-loanable-funds curves and two supply-of-loanable-funds curves. S 51 B F D2 A D Refer to Figure 26-3. Which of
Step by Step Solution
There are 3 Steps involved in it
Step: 1

Get Instant Access to Expert-Tailored Solutions
See step-by-step solutions with expert insights and AI powered tools for academic success
Step: 2

Step: 3
Ace Your Homework with AI
Get the answers you need in no time with our AI-driven, step-by-step assistance
Get Started
Applied Econometric Time Series
Authors: Walter Enders
4th Edition
1118808568, 9781118808566