Question
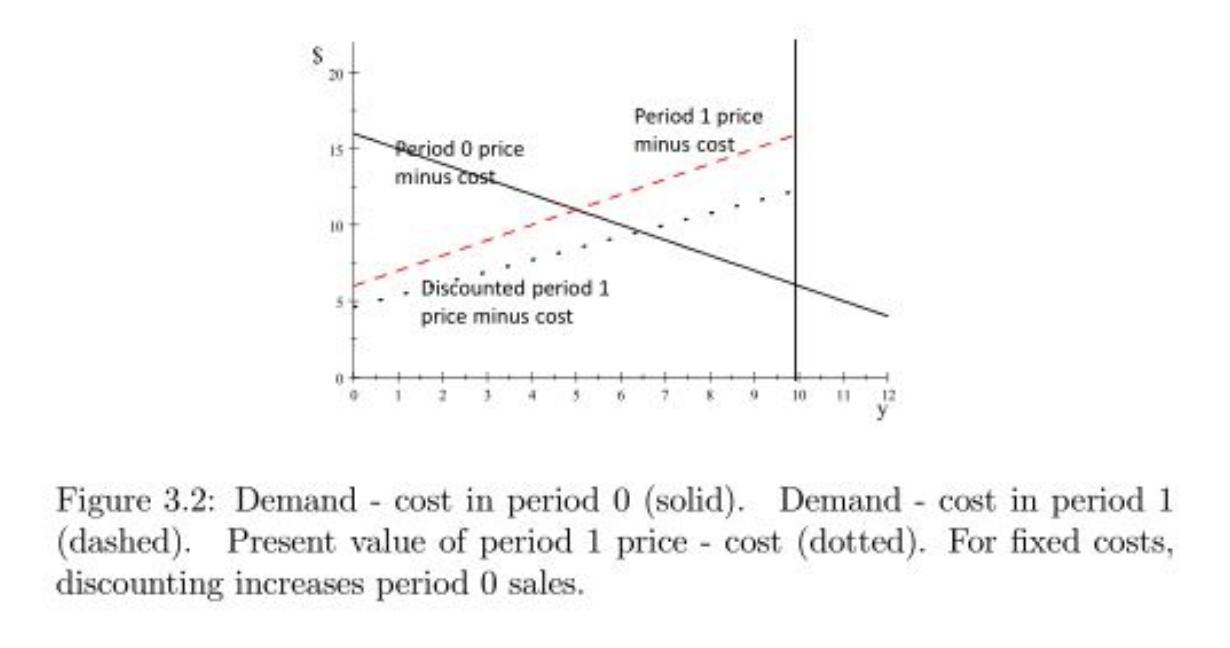
Figure 3.2 holds costs fixed at c = 4 and shows the effect of introducing discounting (moving from = 1 to = 0.77).
Figure 3.2 holds costs fixed at c = 4 and shows the effect of introducing discounting (moving from ρ = 1 to ρ = 0.77). This exercise asks you to create a figure showing the effect of changing costs, for a fixed discount factor.
(a) Using the the inverse demand function p = 20 − y, the initial stock x = 10, zero costs, c = 0, and the discount factor ρ = 0.77, create a figure showing the graphs of 20−y and ρ (20 − (10 − y)); make these graphs solid lines, for ease of identification. Identify the equilibrium period-0 sales as point B.
(b) Now graph the relevant lines (needed to identify the equilibrium) when c = 4; make these graphs dashed lines for ease of identification. Identify the equilibrium period 0 sales as point A.
(c) How does an increase in marginal costs from 0 to 4 affect period 0 sales? Provide a brief economic explanation for this result.
20 Period 1 price minus cost feriod 0 price minus Cost 1s+ 10 Discounted period 1 price minus cost 10 11 12 Figure 3.2: Demand cost in period 0 (solid). Demand cost in period 1 (dashed). Present value of period 1 price - cost (dotted). For fixed costs, discounting increases period 0 sales.
Step by Step Solution
3.38 Rating (148 Votes )
There are 3 Steps involved in it
Step: 1
a Demand timely solid costs Demand costs in period 1 Current period of period 1 value cost consumers Dotted line at current time1 price discounting cost with discounted price 077 In this case the equa...
Get Instant Access to Expert-Tailored Solutions
See step-by-step solutions with expert insights and AI powered tools for academic success
Step: 2

Step: 3

Ace Your Homework with AI
Get the answers you need in no time with our AI-driven, step-by-step assistance
Get Started


