

Answered step by step
Verified Expert Solution
Question
1 Approved Answer
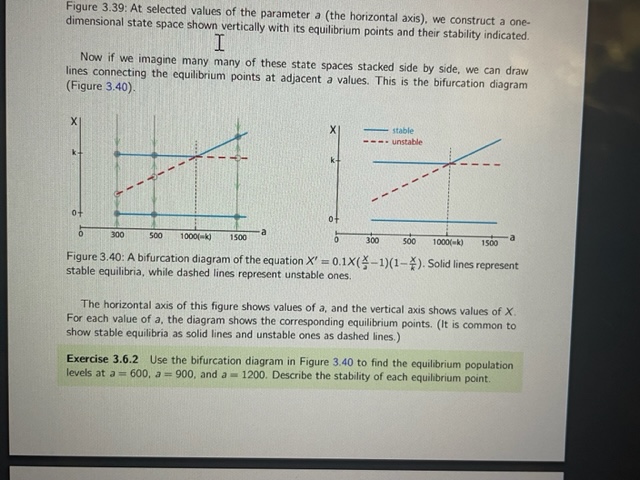
Figure 3.39: At selected values of the parameter a (the horizontal axis), we construct a one- dimensional state space shown vertically with its equilibrium points

Step by Step Solution
There are 3 Steps involved in it
Step: 1

Get Instant Access to Expert-Tailored Solutions
See step-by-step solutions with expert insights and AI powered tools for academic success
Step: 2

Step: 3
Ace Your Homework with AI
Get the answers you need in no time with our AI-driven, step-by-step assistance
Get Started
Paradoxes In Mathematics
Authors: Stanley J Farlow
1st Edition
0486791734, 9780486791739