Question
Figure 4-6 shows the demand and supply curves for the almond market. The government believes that the equilibrium price is too low and tries


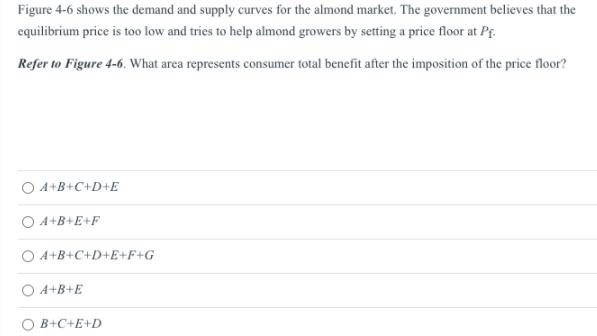
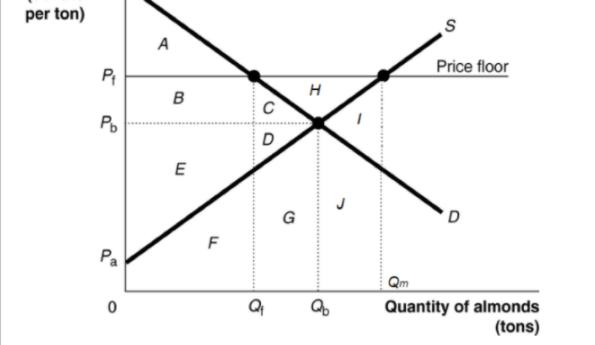
Figure 4-6 shows the demand and supply curves for the almond market. The government believes that the equilibrium price is too low and tries to help almond growers by setting a price floor at Pf. Refer to Figure 4-6. What area represents consumer total benefit after the imposition of the price floor? O 4+B+C+D+E O 4+B+E+F O 4+B+C+D+E+F+G O 4+B+E O B+C+E+D per ton) A Price floor Po D G Pa Qm Quantity of almonds (tons)
Step by Step Solution
3.47 Rating (147 Votes )
There are 3 Steps involved in it
Step: 1
C ABCDEFG Reason The consumer benefit is the sum of all the ...
Get Instant Access to Expert-Tailored Solutions
See step-by-step solutions with expert insights and AI powered tools for academic success
Step: 2

Step: 3

Ace Your Homework with AI
Get the answers you need in no time with our AI-driven, step-by-step assistance
Get StartedRecommended Textbook for
Microeconomics
Authors: Paul Krugman, Robin Wells
5th edition
1319098780, 1319098789, 978-1319098780
Students also viewed these Accounting questions
Question
Answered: 1 week ago
Question
Answered: 1 week ago
Question
Answered: 1 week ago
Question
Answered: 1 week ago
Question
Answered: 1 week ago
Question
Answered: 1 week ago
Question
Answered: 1 week ago
Question
Answered: 1 week ago
Question
Answered: 1 week ago
Question
Answered: 1 week ago
Question
Answered: 1 week ago
Question
Answered: 1 week ago
Question
Answered: 1 week ago
Question
Answered: 1 week ago
Question
Answered: 1 week ago
Question
Answered: 1 week ago
Question
Answered: 1 week ago
Question
Answered: 1 week ago
Question
Answered: 1 week ago
Question
Answered: 1 week ago
Question
Answered: 1 week ago
Question
Answered: 1 week ago
View Answer in SolutionInn App


