Answered step by step
Verified Expert Solution
Question
1 Approved Answer
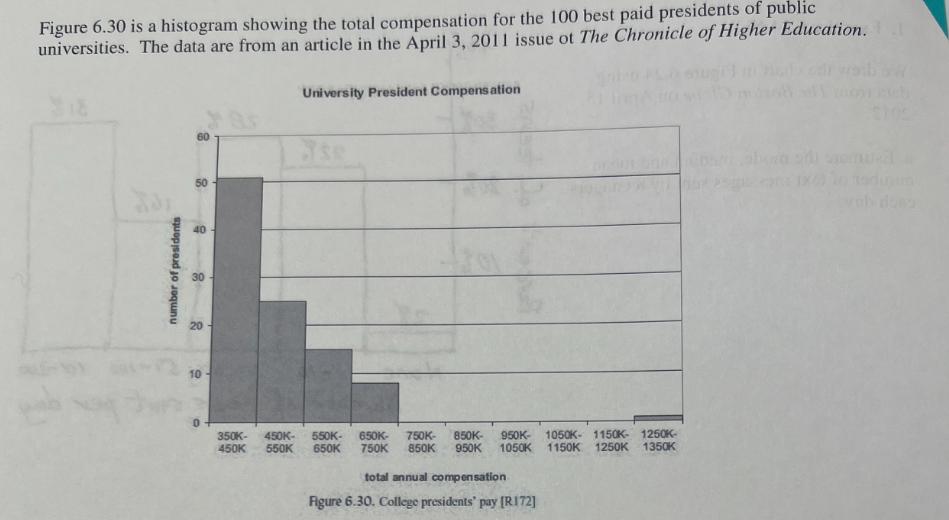
Figure 6.30 is a histogram showing the total compensation for the 100 best paid presidents of public universities. The data are from an article


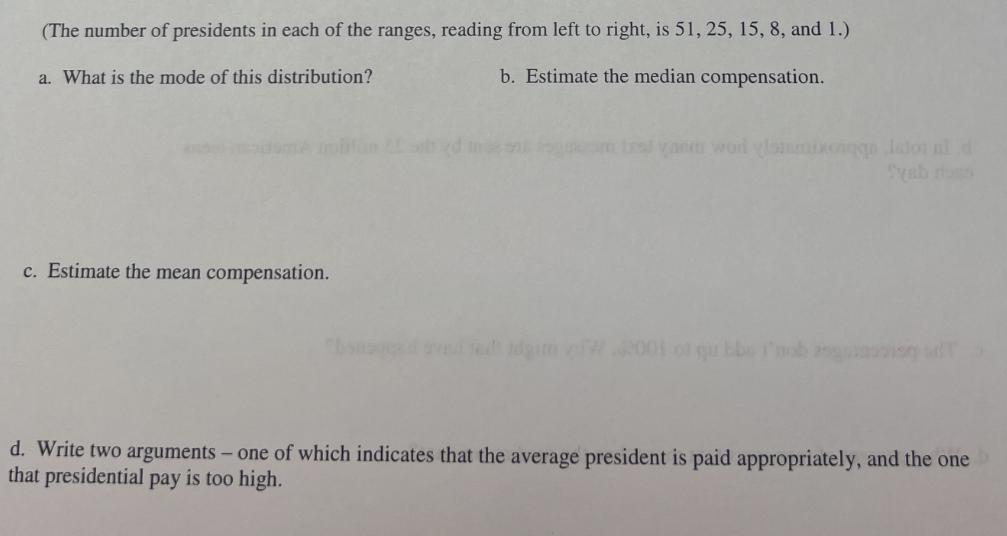
Figure 6.30 is a histogram showing the total compensation for the 100 best paid presidents of public universities. The data are from an article in the April 3, 2011 issue of The Chronicle of Higher Education. University President Compensation AUT number of presidents 60 se 50 40 30 20 20 10 350K- 450K- 550K- 450K 550K 650K 650K- 750K- 850K- 950K- 1050K- 1150K- 1250K- 750K 850K 950K 1050K 1150K 1250K 1350K total annual compensation Figure 6.30. College presidents' pay [R172] (The number of presidents in each of the ranges, reading from left to right, is 51, 25, 15, 8, and 1.) a. What is the mode of this distribution? c. Estimate the mean compensation. b. Estimate the median compensation. teal yarm word glammikoiggo lalo ald Syab dogs Thonged trend sedim 2001 of gubbe 'nob angin ad d. Write two arguments - one of which indicates that the average president is paid appropriately, and the one that presidential pay is too high.
Step by Step Solution
There are 3 Steps involved in it
Step: 1

Get Instant Access to Expert-Tailored Solutions
See step-by-step solutions with expert insights and AI powered tools for academic success
Step: 2

Step: 3

Ace Your Homework with AI
Get the answers you need in no time with our AI-driven, step-by-step assistance
Get Started


