Answered step by step
Verified Expert Solution
Question
1 Approved Answer
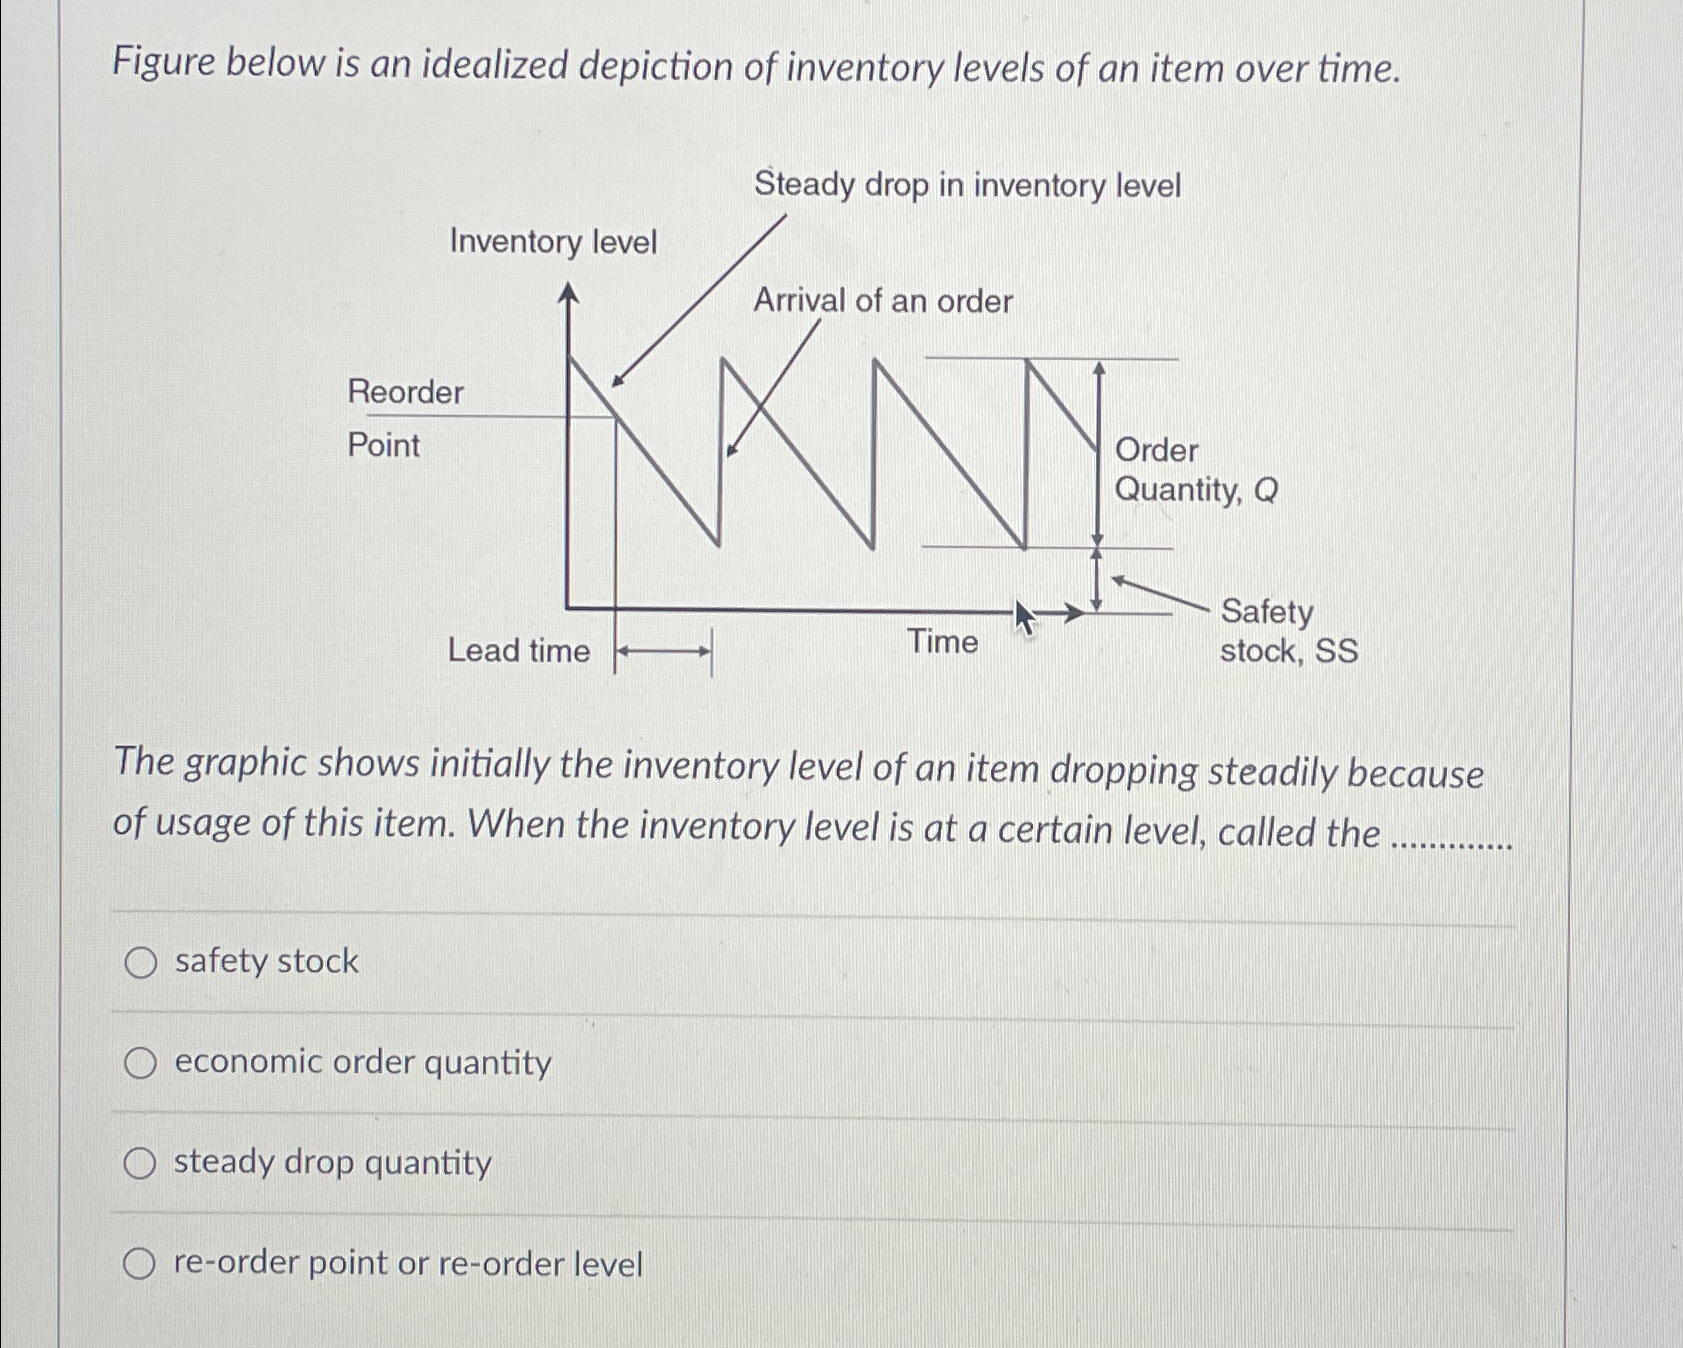
Figure below is an idealized depiction of inventory levels of an item over time. Steady drop in inventory level The graphic shows initially the inventory
Figure below is an idealized depiction of inventory levels of an item over time.
Steady drop in inventory level
The graphic shows initially the inventory level of an item dropping steadily because of usage of this item. When the inventory level is at a certain level, called the
safety stock
economic order quantity
steady drop quantity
reorder point or reorder level

Step by Step Solution
There are 3 Steps involved in it
Step: 1

Get Instant Access to Expert-Tailored Solutions
See step-by-step solutions with expert insights and AI powered tools for academic success
Step: 2

Step: 3

Ace Your Homework with AI
Get the answers you need in no time with our AI-driven, step-by-step assistance
Get Started


