

Question
Figure below shows the output from a regression of the following variables: -QUANTITY: number of cars sold in US, in thousands -PRICE: index of inflation-adjusted
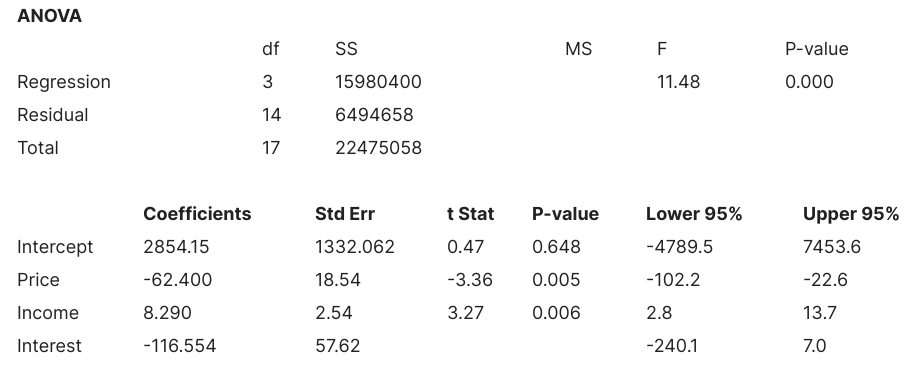
Figure below shows the output from a regression of the following variables:
-QUANTITY: number of cars sold in US, in thousands
-PRICE: index of inflation-adjusted car prices
-INCOME: inflation-adjusted measure of disposable income, in thousands
-INTEREST: prime rate of interest
We have one value of each of these variables for each year running from 1970 to 1987. QUANTITY is the dependent variable.
Regression Statistics:
Multiple R = 0.843
R Square = 0.711
Adjusted R Square = 0.649
Standard Error Observations = 18
Step by Step Solution
There are 3 Steps involved in it
Step: 1

Get Instant Access to Expert-Tailored Solutions
See step-by-step solutions with expert insights and AI powered tools for academic success
Step: 2

Step: 3
Ace Your Homework with AI
Get the answers you need in no time with our AI-driven, step-by-step assistance
Get Started
Linear Algebra With Applications
Authors: Gareth Williams, Williams
9th Edition
1284120104, 9781284120103