

Answered step by step
Verified Expert Solution
Question
1 Approved Answer
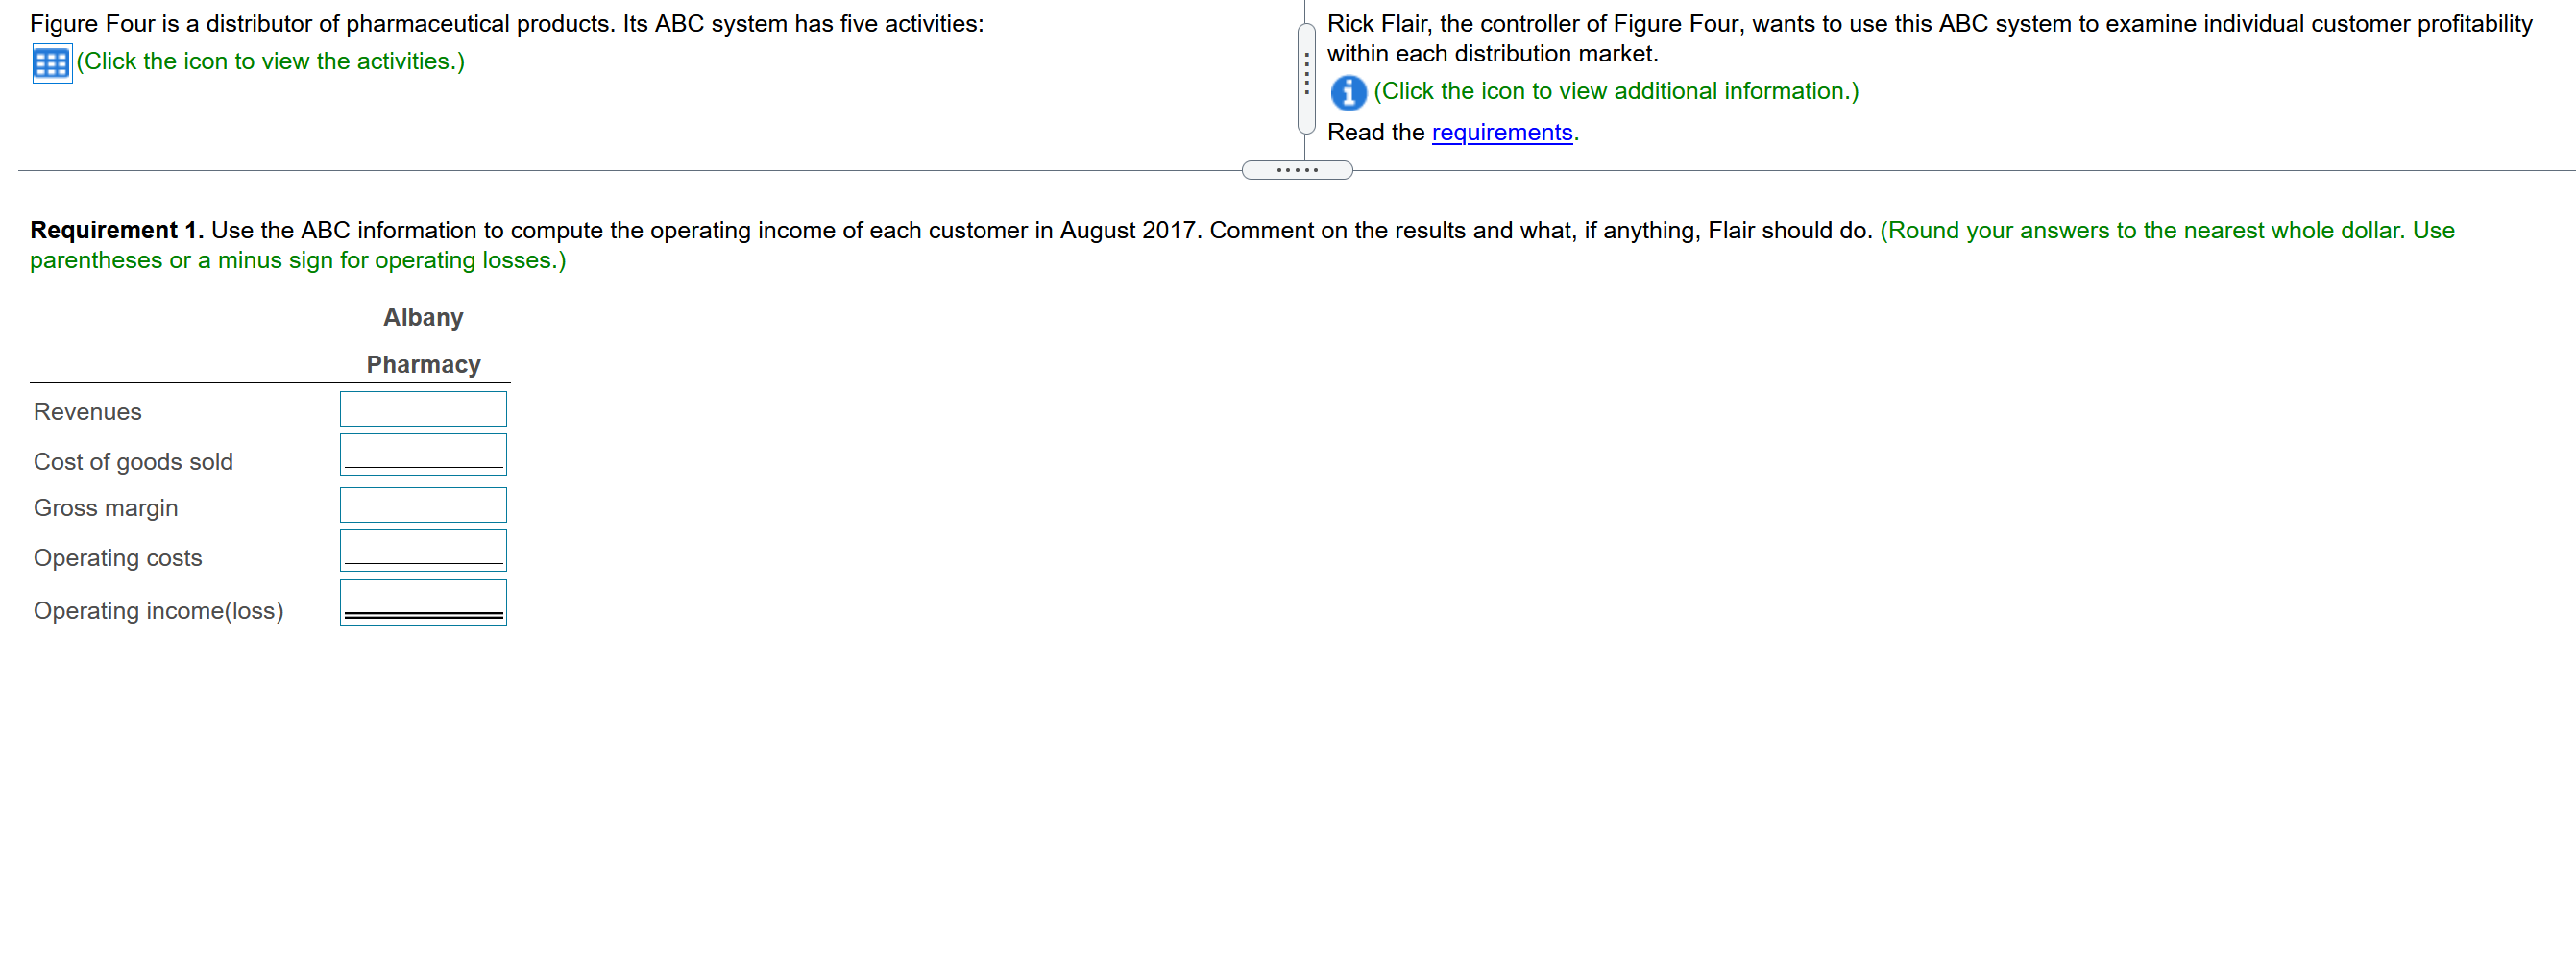
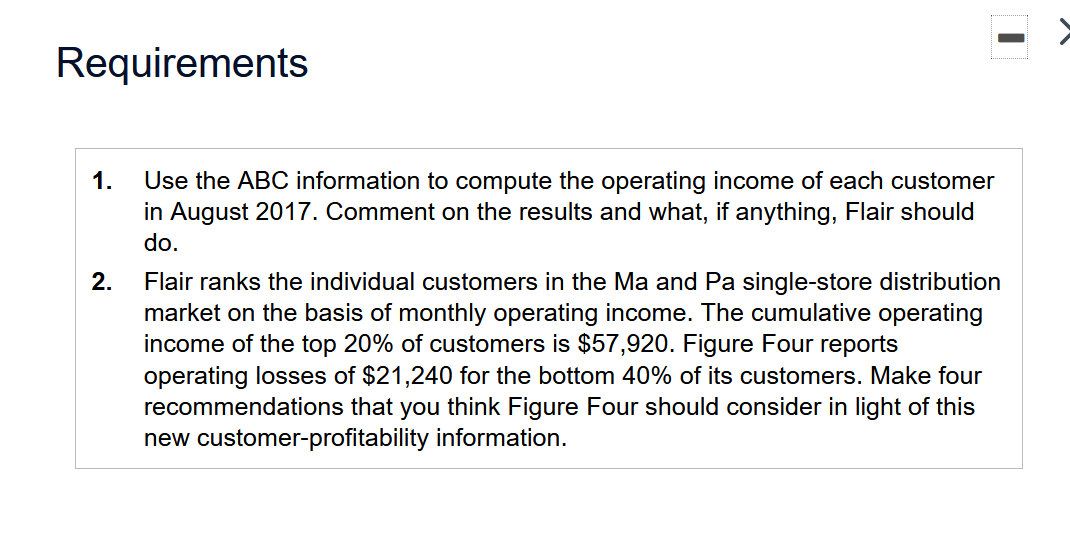
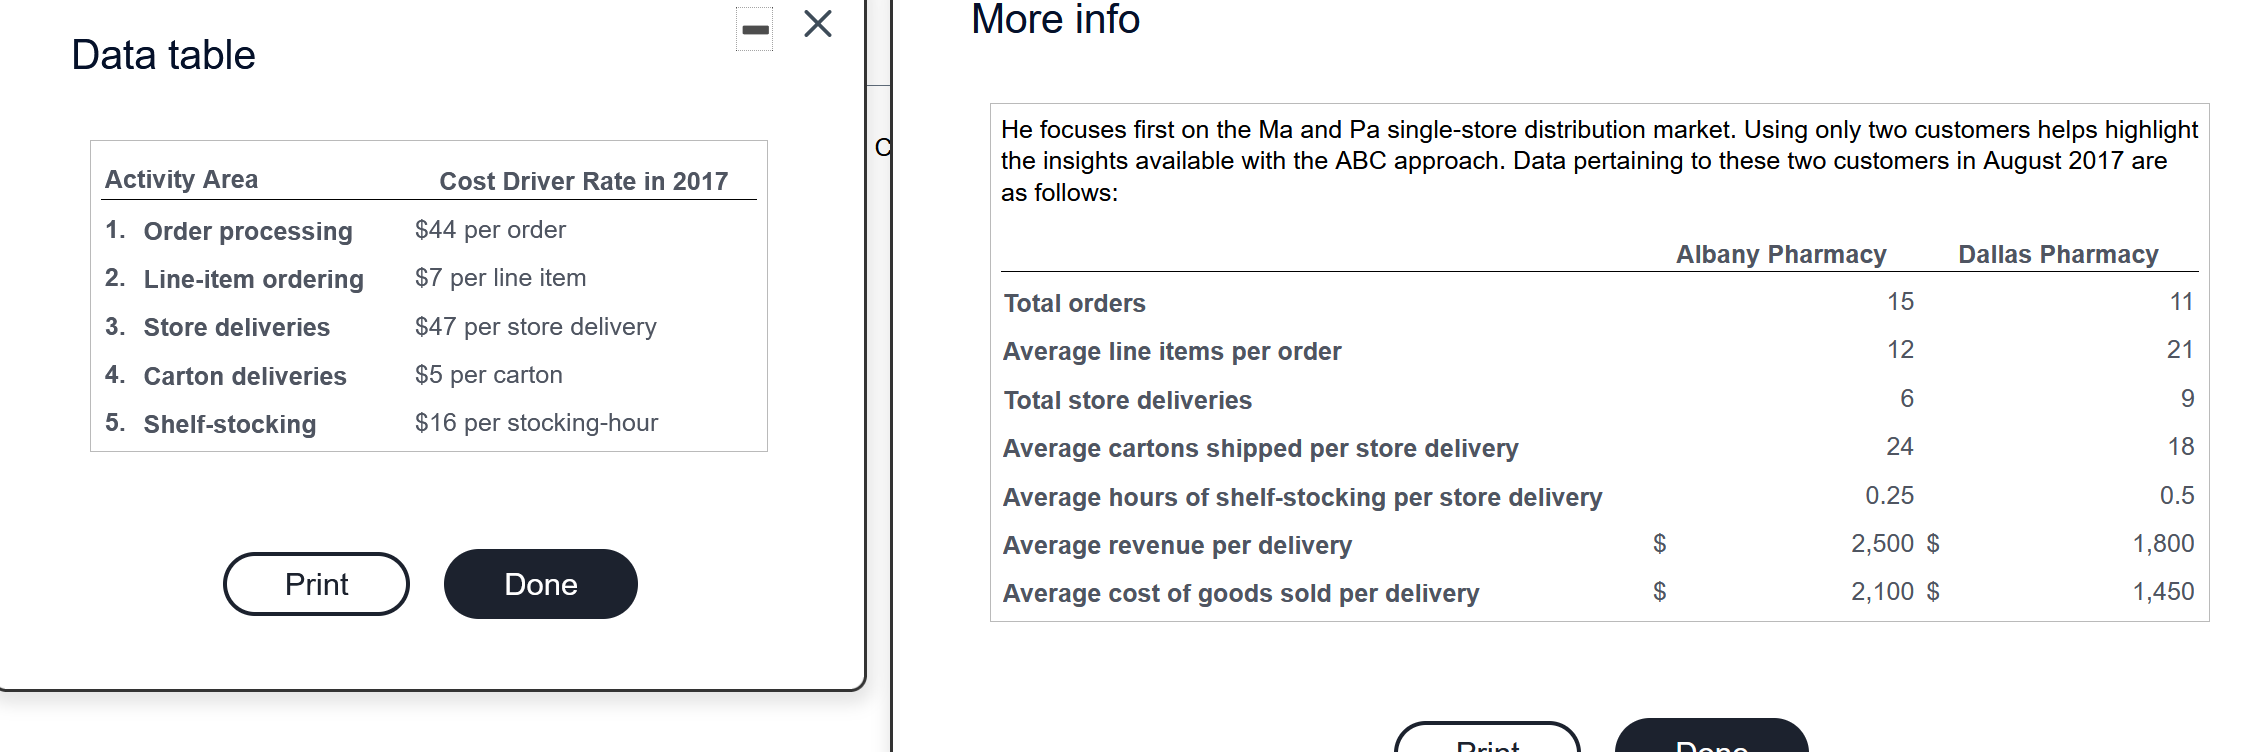
Figure Four is a distributor of pharmaceutical products. Its ABC system has five activities: (Click the icon to view the activities.) Rick Flair, the controller
Step by Step Solution
There are 3 Steps involved in it
Step: 1

Get Instant Access to Expert-Tailored Solutions
See step-by-step solutions with expert insights and AI powered tools for academic success
Step: 2

Step: 3
Ace Your Homework with AI
Get the answers you need in no time with our AI-driven, step-by-step assistance
Get Started
Accountancy And The Changing Landscape Of Integrated Reporting
Authors: Ioana Dragu
1st Edition
1522536221, 9781522536222