

Answered step by step
Verified Expert Solution
Question
1 Approved Answer
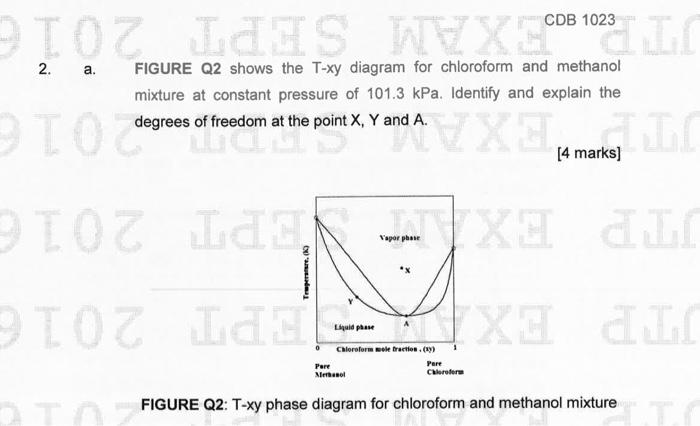
FIGURE Q2 shows the T-xy diagram for chloroform and methanol mixture at constant pressure of 101.3kPa. Identify and explain the degrees of freedom at the
Step by Step Solution
There are 3 Steps involved in it
Step: 1

Get Instant Access to Expert-Tailored Solutions
See step-by-step solutions with expert insights and AI powered tools for academic success
Step: 2

Step: 3
Ace Your Homework with AI
Get the answers you need in no time with our AI-driven, step-by-step assistance
Get Started
An Introduction To Fluid Mechanics
Authors: Faith A. Morrison
1st Edition
1107003539, 9781107003538