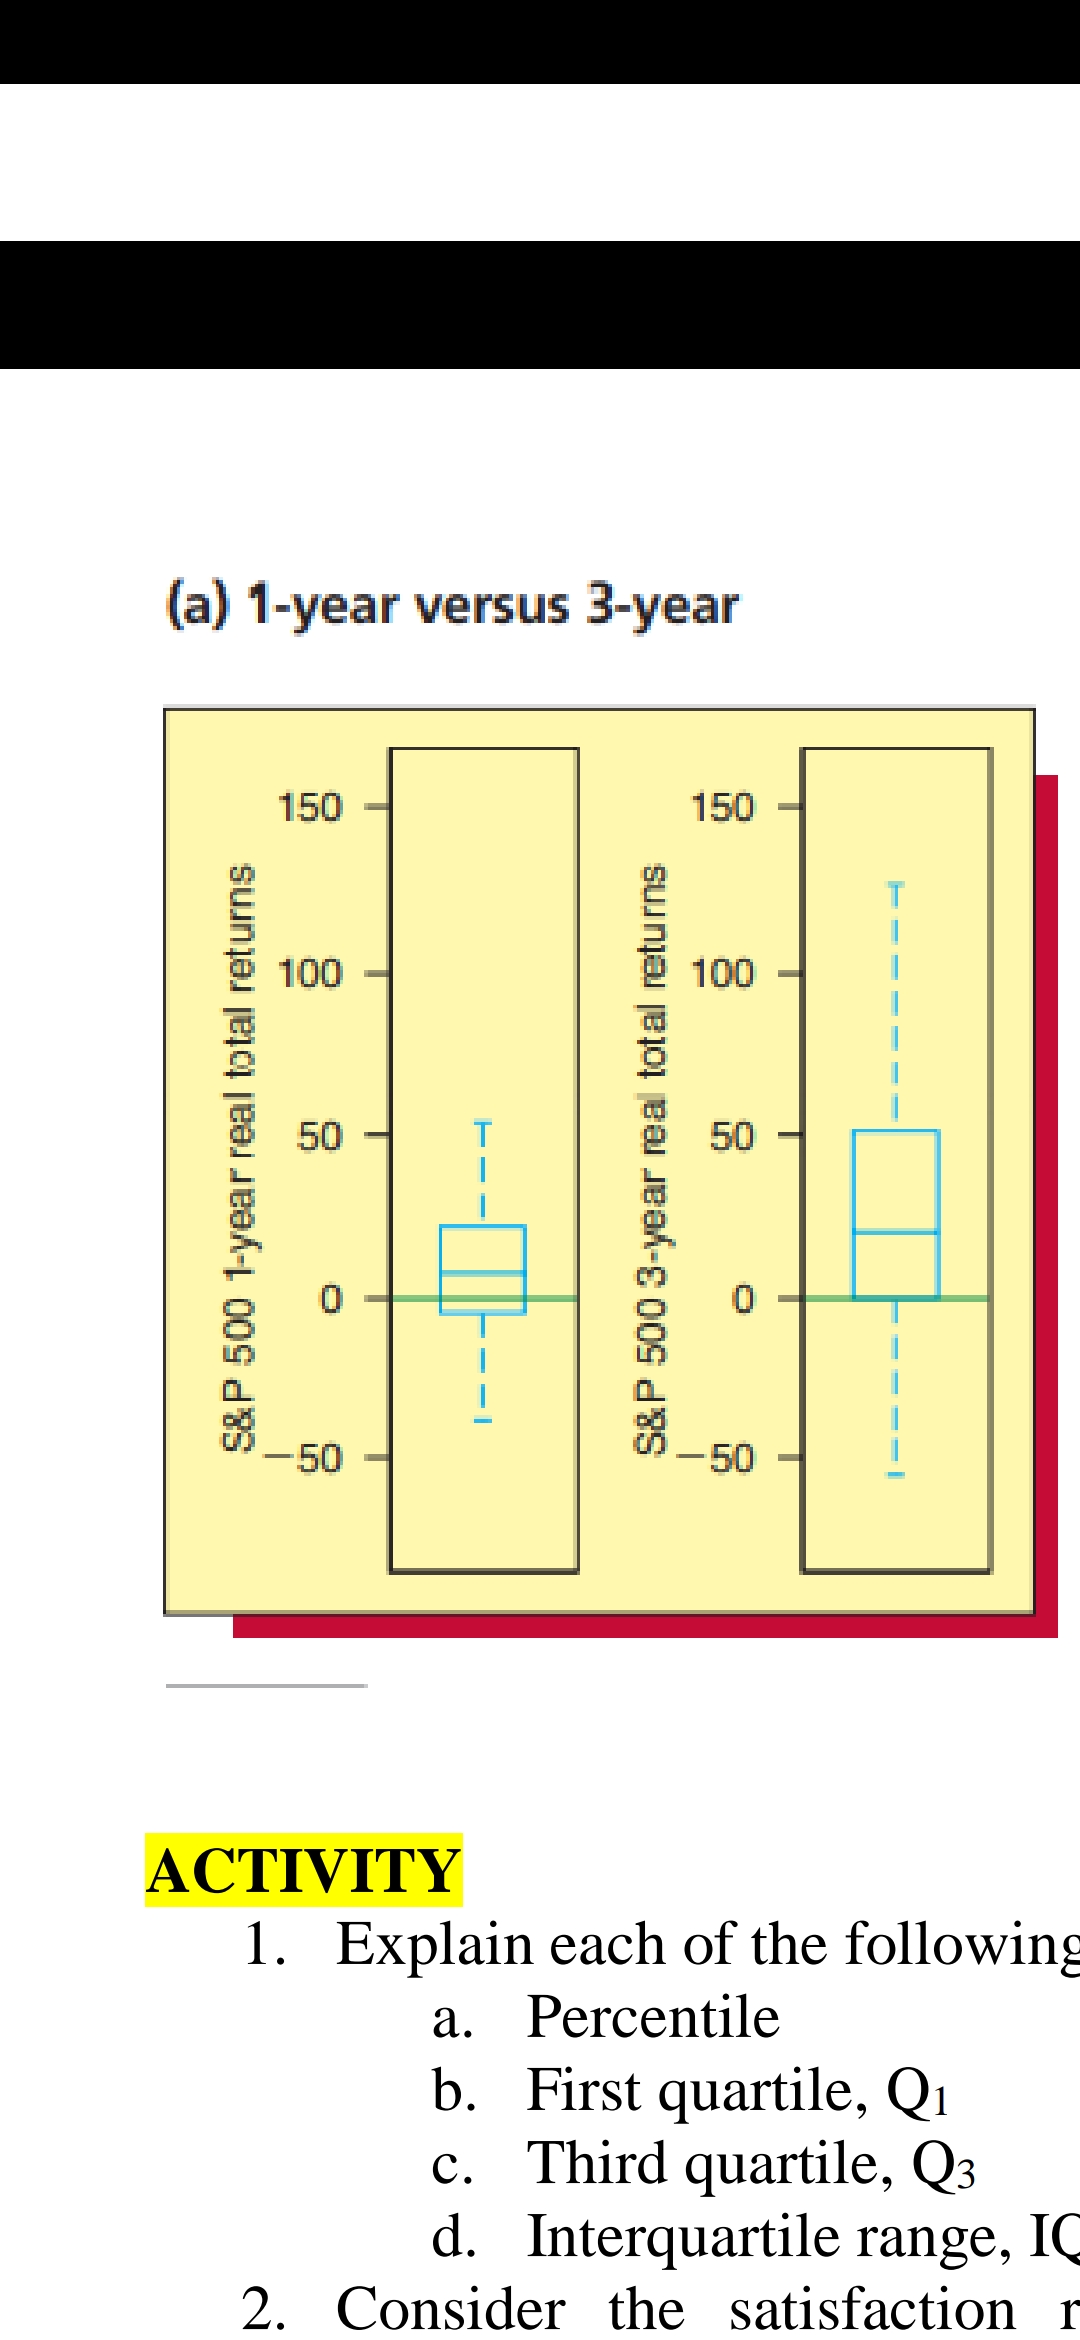
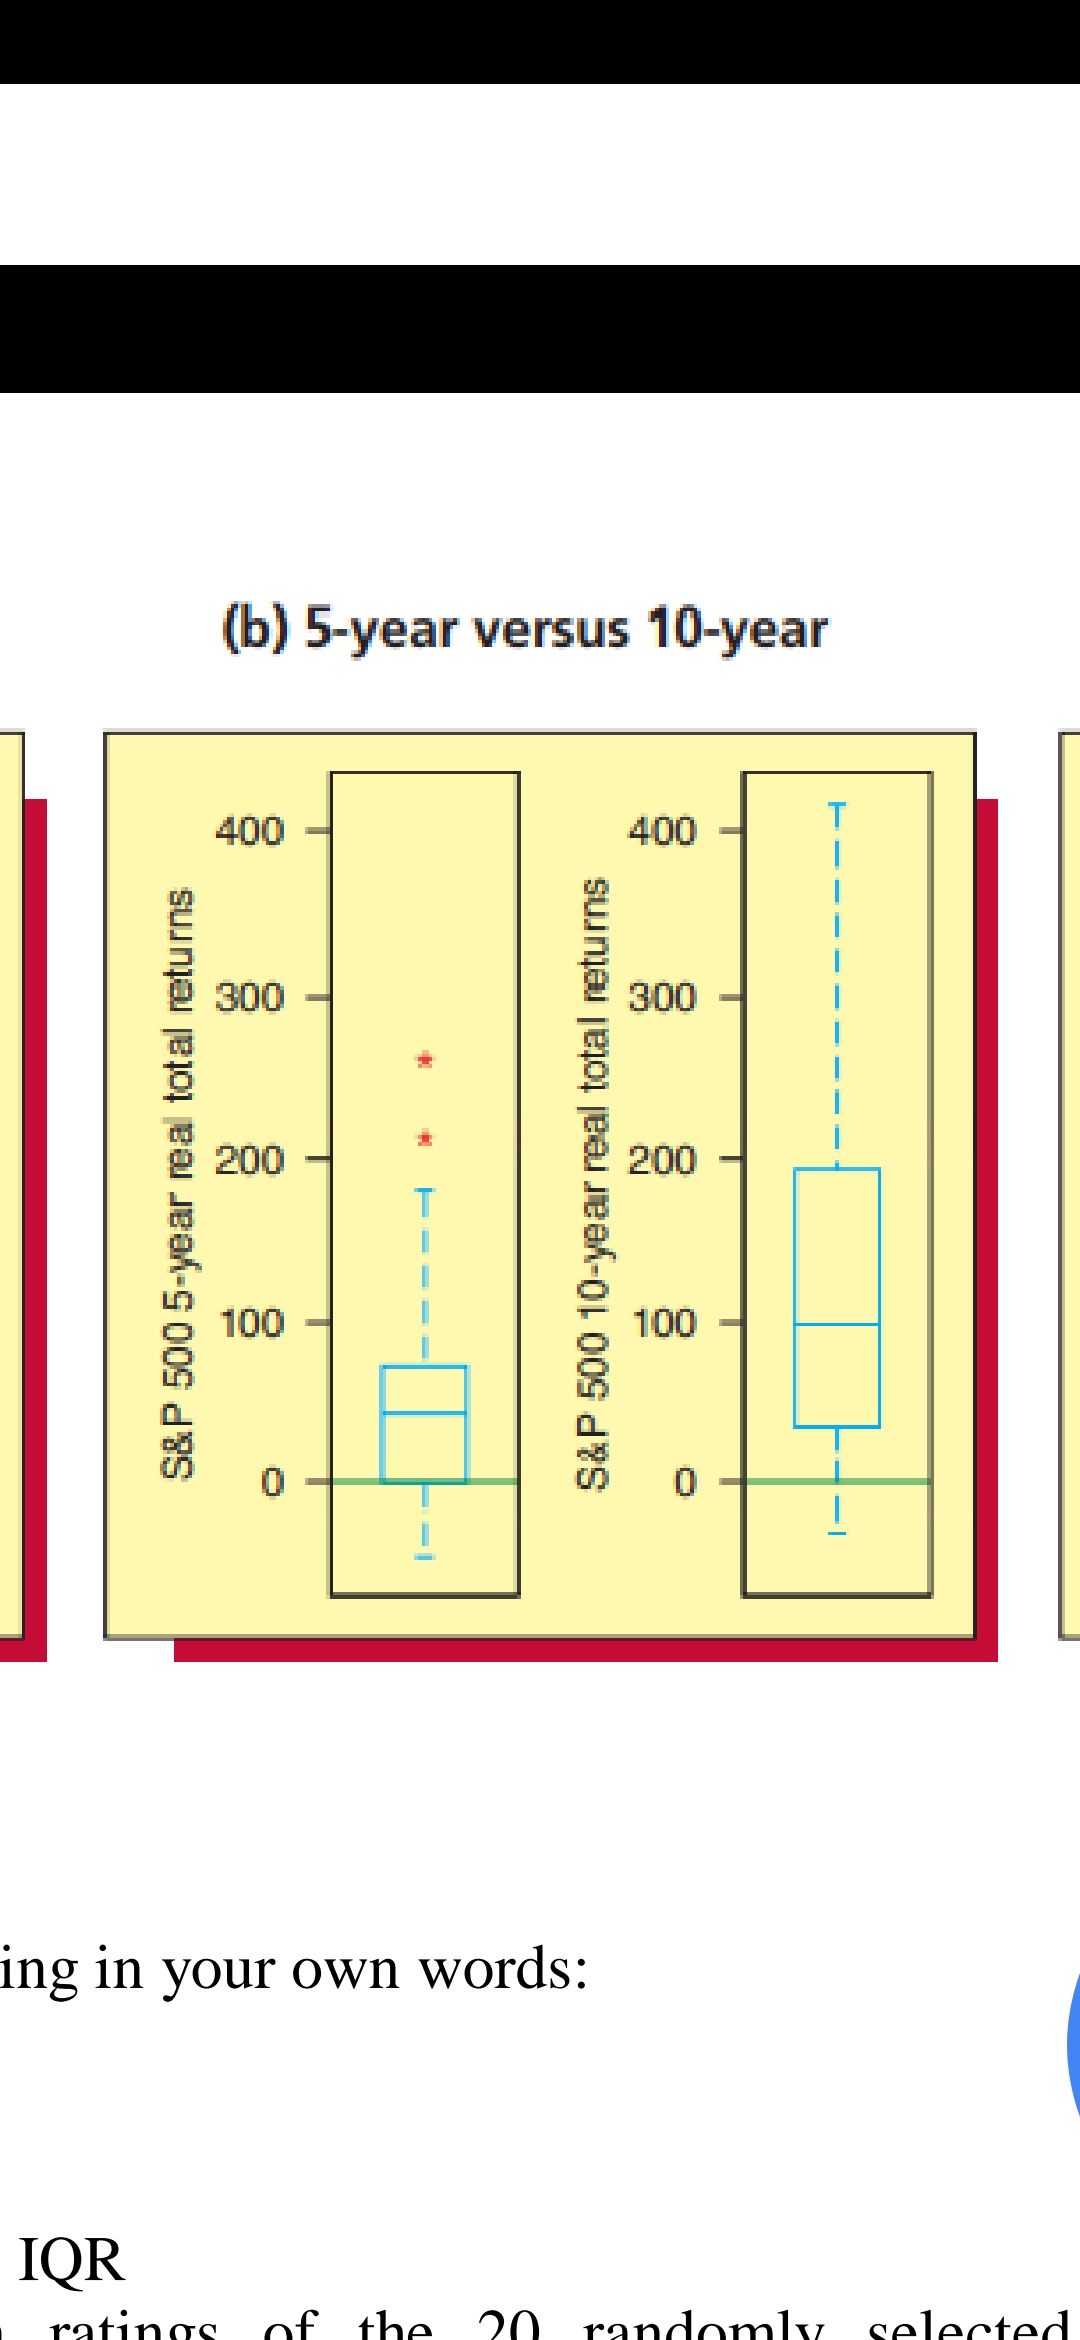
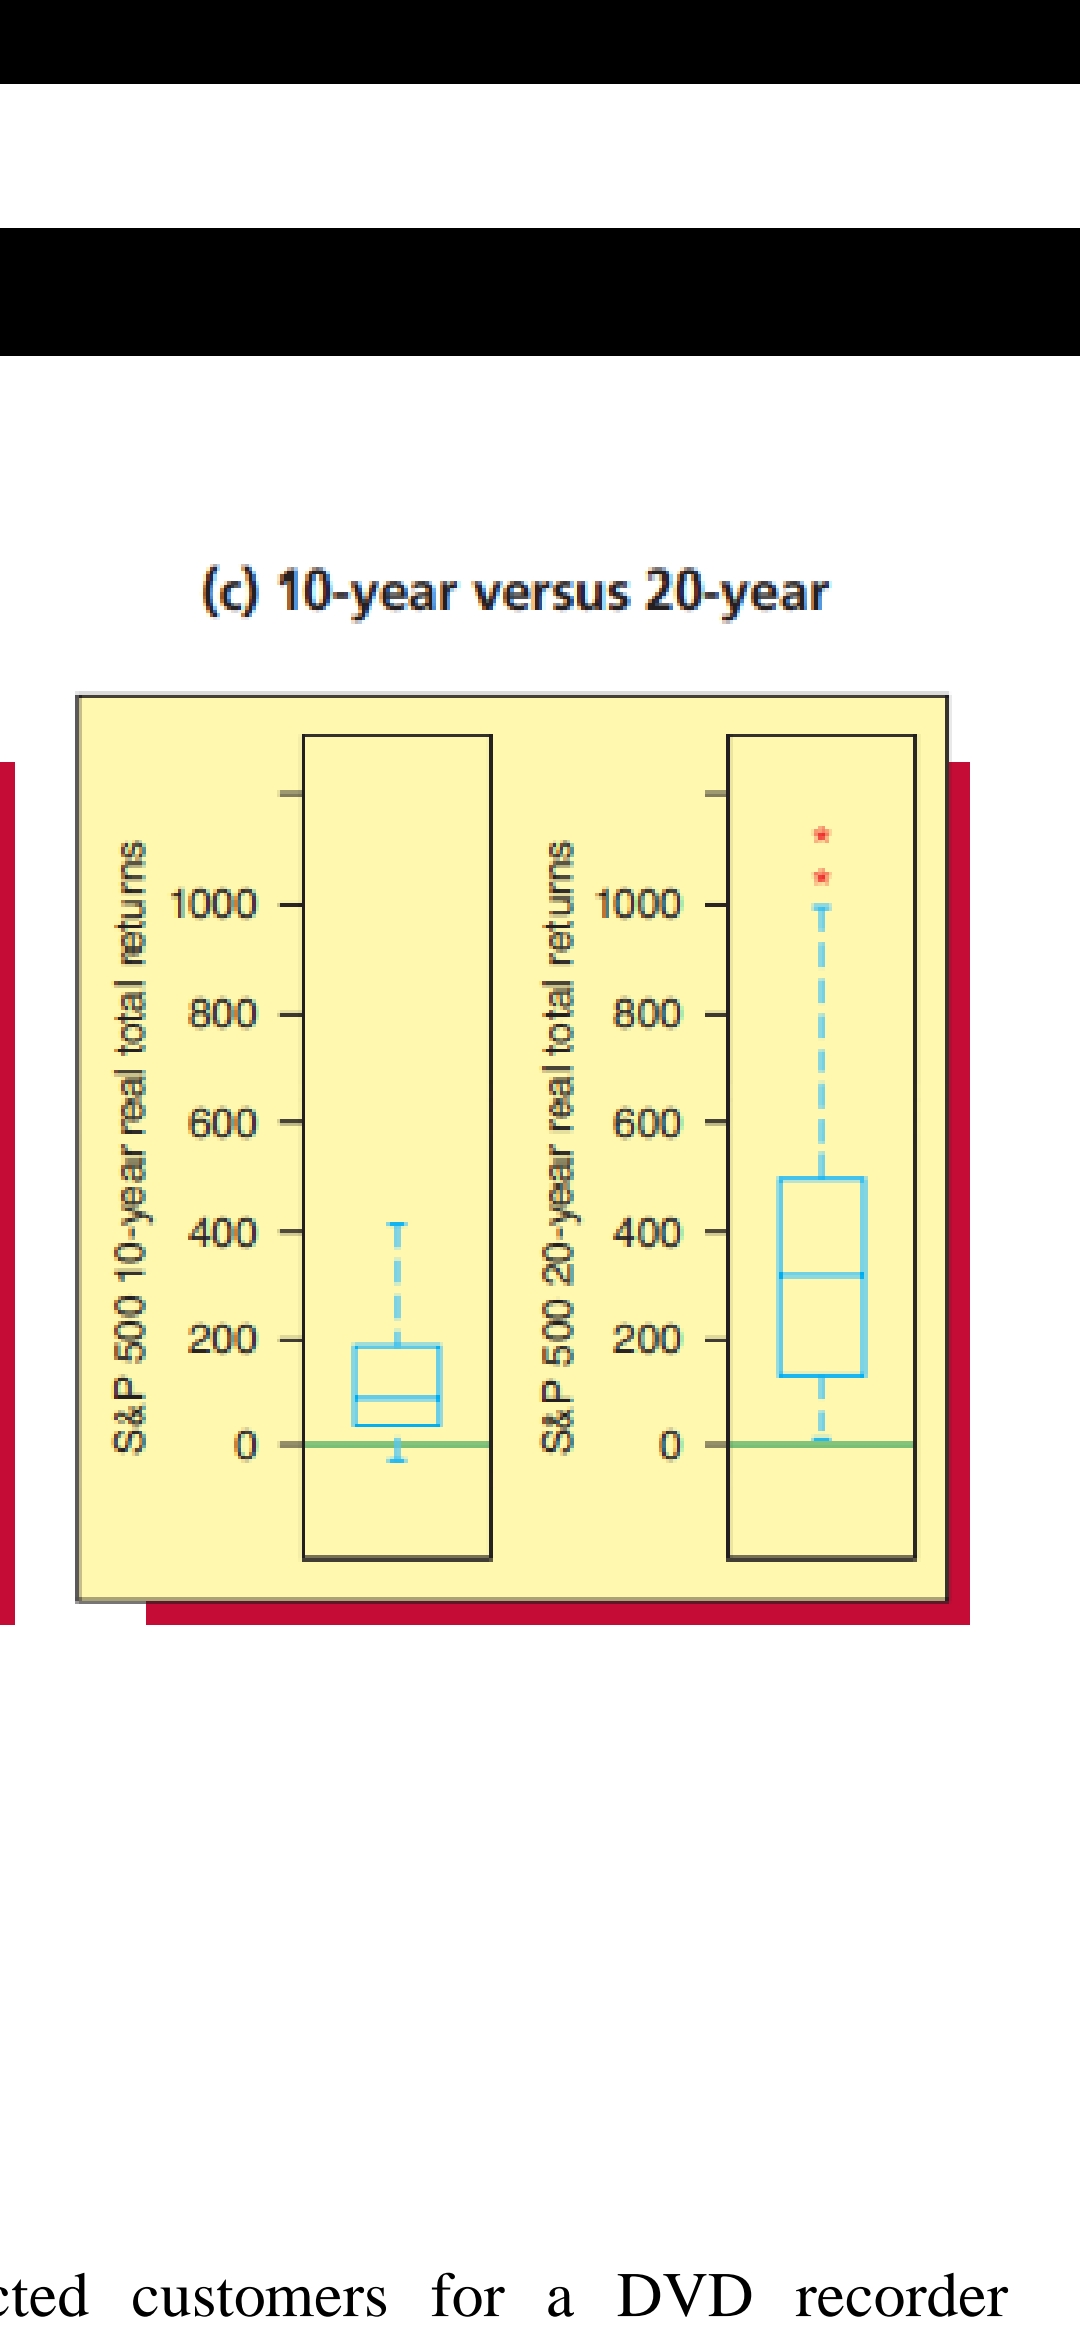
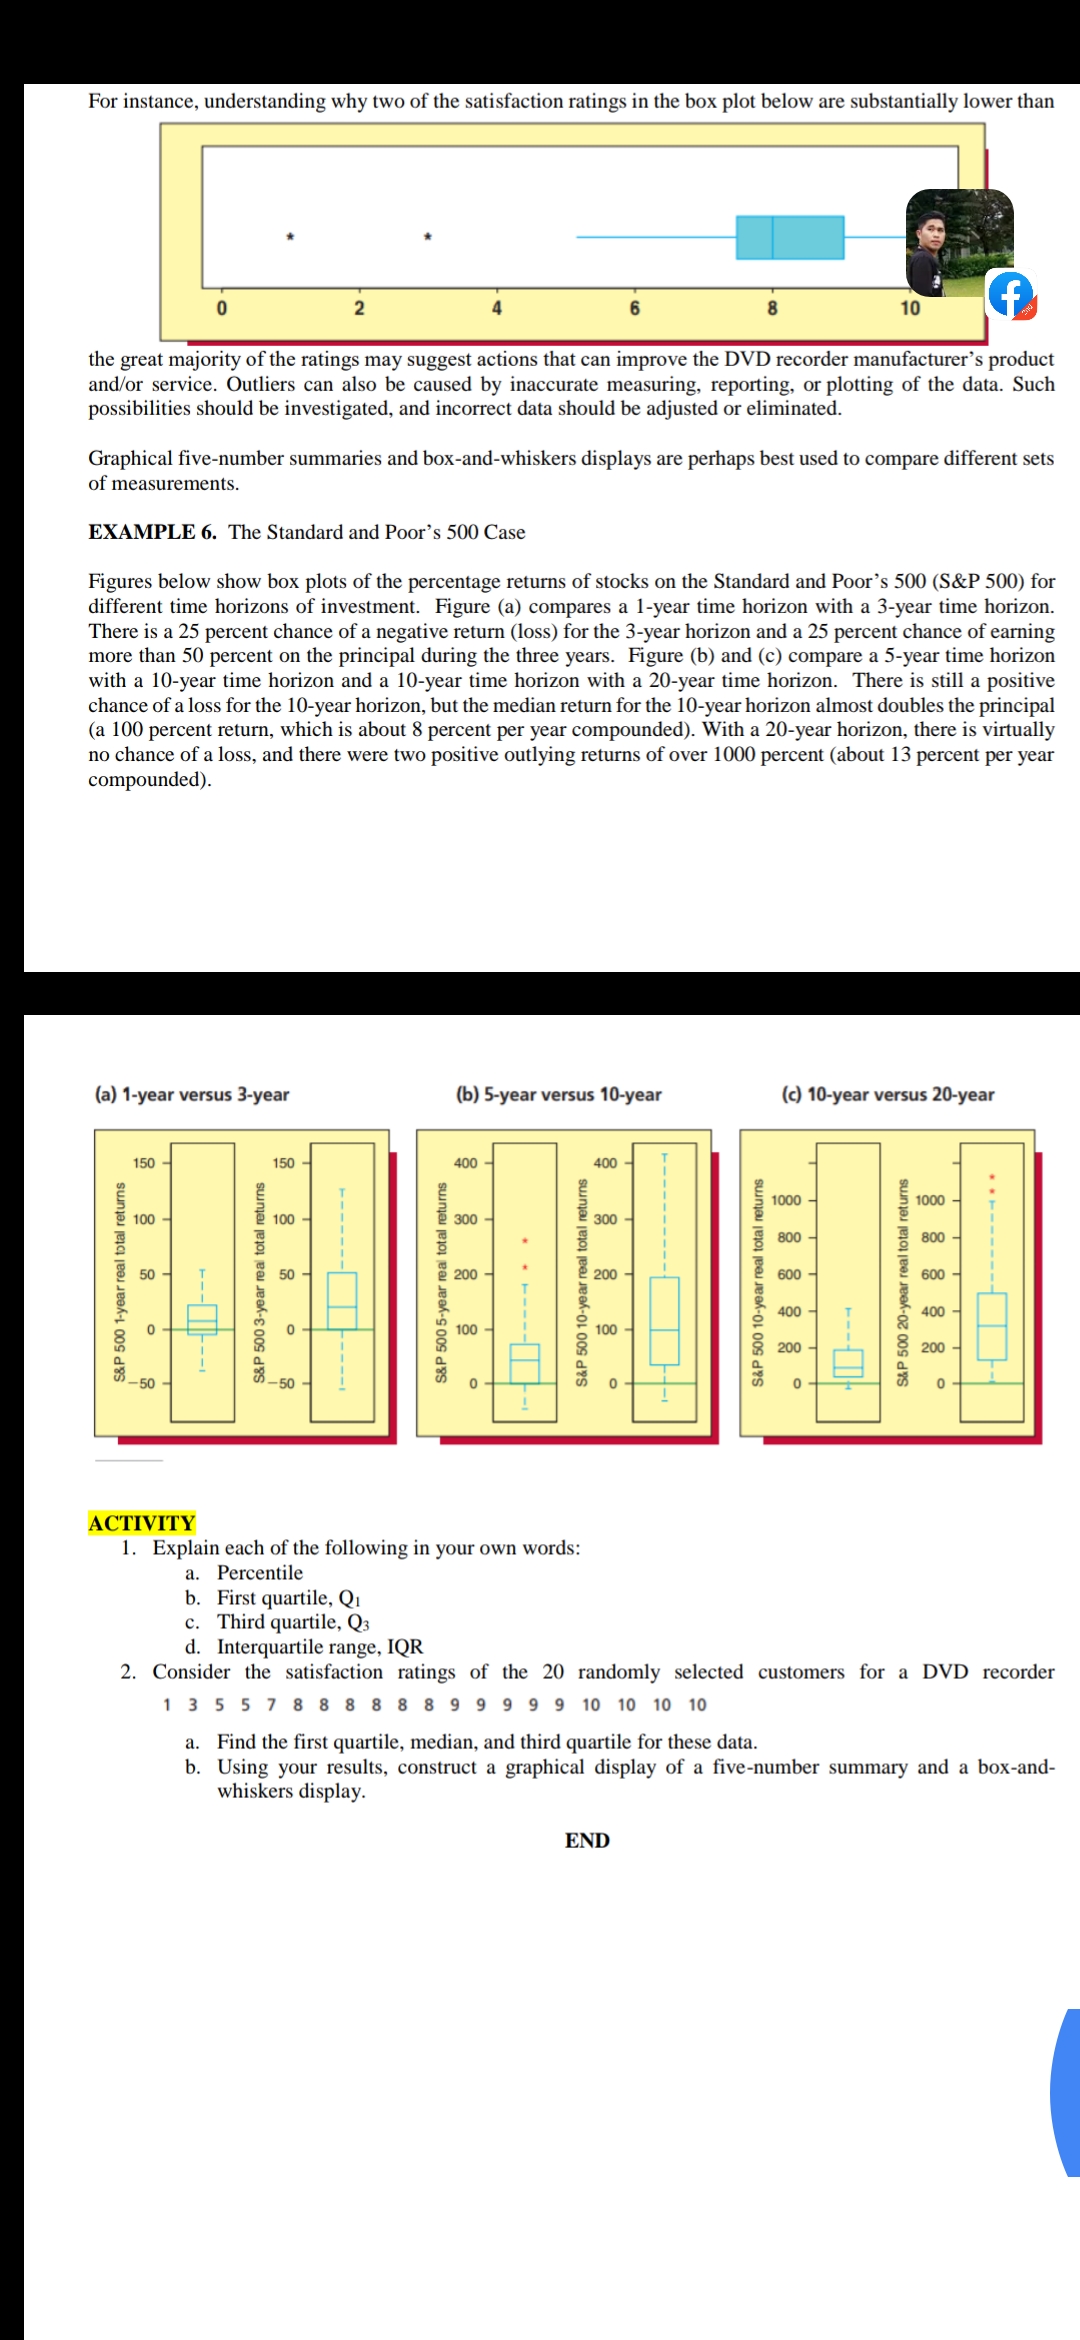
Figures below show box plots of the percentage returns of stocks on the Standard and Poor's 500 (S&P 500) for
different time horizons of investment. Figure (a) compares a 1-year time horizon with a 3-year time horizon.
There is a 25 percent chance of a negative return (loss) for the 3-year horizon and a 25 percent chance of earning
more than 50 percent on the principal during the three years. Figure (b) and (c) compare a 5-year time horizon
with a 10-year time horizon and a 10-year time horizon with a 20-year time horizon. There is still a positive
chance of a loss for the 10-year horizon, but the median return for the 10-year horizon almost doubles the principal
(a 100 percent return, which is about 8 percent per year compounded). With a 20-year horizon, there is virtually
no chance of a loss, and there were two positive outlying returns of over 1000 percent (about 13 percent per year
compounded).
i will atttached the figure
1. Explain each of the following in your own words:
a. Percentile
b. First quartile, Q1
c. Third quartile, Q3
d. Interquartile range, IQR
2. Consider the satisfaction ratings of the 20 randomly selected customers for a DVD recorder
a. Find the first quartile, median, and third quartile for these data.
b. Using your results, construct a graphical display of a five-number summary and a box-and-
whiskers display.
(a) 1-year versus 3-year 150 150 100 100 50 50 S&P 500 3-year real total returns S&P 500 1-year real total returns 0 -50 -50 ACTIVITY 1. Explain each of the following a. Percentile b. First quartile, Q1 c. Third quartile, Q3 d. Interquartile range, IC 2. Consider the satisfaction r\f(c) 10-year versus 20-year 1000 1000 800 800 600 600 SAP 500 20-year real total returns S&P 500 10-year real total returns 400 400 200 200 0 ted customers for a DVD recorderFor instance, understanding why two of the satisfaction ratings in the box plot below are substantially lower than 10 the great majority of the ratings may suggest actions that can improve the DVD recorder manufacturer's product and/or service. Outliers can also be caused by inaccurate measuring, reporting, or plotting of the data. Such possibilities should be investigated, and incorrect data should be adjusted or eliminated. Graphical five-number summaries and box-and-whiskers displays are perhaps best used to compare different sets of measurements. EXAMPLE 6. The Standard and Poor's 500 Case Figures below show box plots of the percentage returns of stocks on the Standard and Poor's 500 (S&P 500) for different time horizons of investment. Figure (a) compares a 1-year time horizon with a 3-year time horizon. There is a 25 percent chance of a negative return (loss) for the 3-year horizon and a 25 percent chance of earning more than 50 percent on the principal during the three years. Figure (b) and (c) compare a 5-year time horizon with a 10-year time horizon and a 10-year time horizon with a 20-year time horizon. There is still a positive chance of a loss for the 10-year horizon, but the median return for the 10-year horizon almost doubles the principal (a 100 percent return, which is about 8 percent per year compounded). With a 20-year horizon, there is virtually no chance of a loss, and there were two positive outlying returns of over 1000 percent (about 13 percent per year compounded). (a) 1-year versus 3-year (b) 5-year versus 10-year (c) 10-year versus 20-year 150 150 400 - 400 - 4 1000 1000 100 100 300 300 800 800 50 50 200 200 600 600 S&P 500 10-year real total returns S&P 500 20-year real total returns S&P 500 10-year real total returns S&P 500 3-year real total returns S&P 500 1-year real total returns S&P 500 5-year real total returns 400 400 0 100 100 200 II--- 200 O ACTIVITY 1. Explain each of the following in your own words: a. Percentile b. First quartile, Q1 c. Third quartile, Q3 d. Interquartile range, IQR 2. Consider the satisfaction ratings of the 20 randomly selected customers for a DVD recorder 1 3 5 5 7 8 8 8 8 8 8 9 9 9 9 9 10 10 10 10 a. Find the first quartile, median, and third quartile for these data. b. Using your results, construct a graphical display of a five-number summary and a box-and- whiskers display. END


