Answered step by step
Verified Expert Solution
Question
1 Approved Answer
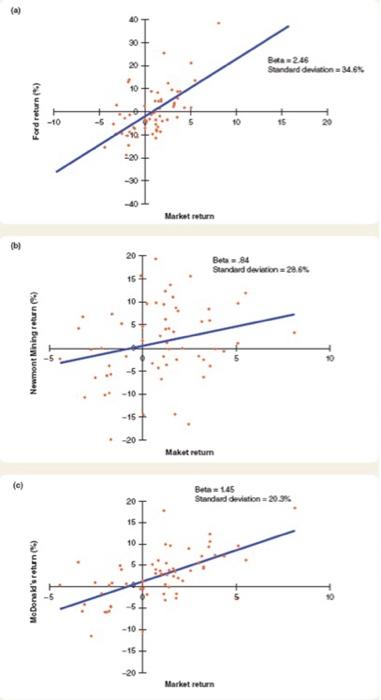
Figures below shows plots of monthly rates of return on three stocks versus the stock market index with Best Fit lines. The beta and standard
Figures below shows plots of monthly rates of return on three stocks versus the stock market index with Best Fit lines. The beta and standard deviation of each stock is given beside its plot. These plots show monthly rates of return for (a) Ford, (b) Newmont Mining, and (c) McDonalds, plus the market portfolio.
Required:
a) Which stock is riskiest to an undiversified investor who puts all her funds in one of these stocks?
b) Pick any 2 companies. What is the expected rate of return on each stock? Use the capital asset pricing model with an expected market risk premium of 8%. The risk-free rate of interest is 4%.

Step by Step Solution
There are 3 Steps involved in it
Step: 1

Get Instant Access to Expert-Tailored Solutions
See step-by-step solutions with expert insights and AI powered tools for academic success
Step: 2

Step: 3

Ace Your Homework with AI
Get the answers you need in no time with our AI-driven, step-by-step assistance
Get Started


