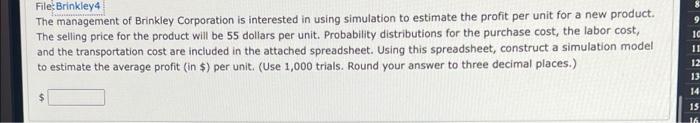
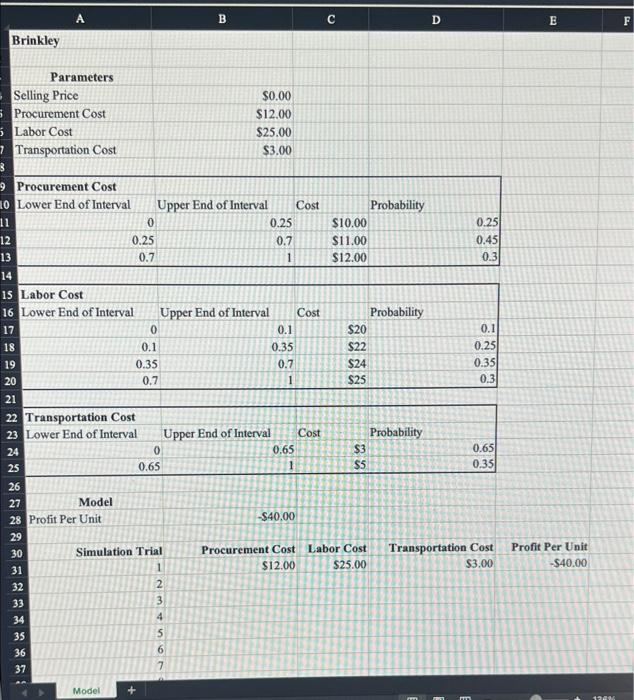
File:Brinkley4 The management of Brinkley Corporation is interested in using simulation to estimate the profit per unit for a new product. The selling price for the product will be 55 dollars per unit. Probability distributions for the purchase cost, the labor cost, and the transportation cost are included in the attached spreadsheet. Using this spreadsheet, construct a simulation model to estimate the average profit (in $) per unit. (Use 1,000 trials. Round your answer to three decimal places.) IC 11 12 13 14 15 16 A B C D E E F Brinkley Parameters Selling Price $0.00 Procurement Cost $12.00 Labor Cost $25.00 7 Transportation Cost $3.00 3 9 Procurement Cost 10 Lower End of Interval Upper End of Interval Cost Probability 11 0 0.25 $10.00 0.25 12 0.25 0.7 $11.00 0.45 13 0.7 1 $12.00 0.3 14 15 Labor Cost 16 Lower End of Interval Upper End of Interval Cost Probability 17 0 0.1 $20 0.1 18 0.1 0.35 $22 0.25 19 0.35 0.7 $24 0.35 20 0.7 1 S25 0.3 21 22 Transportation Cost 23 Lower End of Interval Upper End of Interval Cost Probability 24 0 0.65 $3 0.65 25 0.65 S5 0.35 26 27 Model 28 Profit Per Unit -$40.00 29 30 Simulation Trial Procurement Cost Labor Cost Transportation Cost 31 1 $12.00 $25.00 $3.00 32 2 3 34 4 35 5 36 6 37 7 Profit Per Unit -$40.00 Model 1 File:Brinkley4 The management of Brinkley Corporation is interested in using simulation to estimate the profit per unit for a new product. The selling price for the product will be 55 dollars per unit. Probability distributions for the purchase cost, the labor cost, and the transportation cost are included in the attached spreadsheet. Using this spreadsheet, construct a simulation model to estimate the average profit (in $) per unit. (Use 1,000 trials. Round your answer to three decimal places.) IC 11 12 13 14 15 16 A B C D E E F Brinkley Parameters Selling Price $0.00 Procurement Cost $12.00 Labor Cost $25.00 7 Transportation Cost $3.00 3 9 Procurement Cost 10 Lower End of Interval Upper End of Interval Cost Probability 11 0 0.25 $10.00 0.25 12 0.25 0.7 $11.00 0.45 13 0.7 1 $12.00 0.3 14 15 Labor Cost 16 Lower End of Interval Upper End of Interval Cost Probability 17 0 0.1 $20 0.1 18 0.1 0.35 $22 0.25 19 0.35 0.7 $24 0.35 20 0.7 1 S25 0.3 21 22 Transportation Cost 23 Lower End of Interval Upper End of Interval Cost Probability 24 0 0.65 $3 0.65 25 0.65 S5 0.35 26 27 Model 28 Profit Per Unit -$40.00 29 30 Simulation Trial Procurement Cost Labor Cost Transportation Cost 31 1 $12.00 $25.00 $3.00 32 2 3 34 4 35 5 36 6 37 7 Profit Per Unit -$40.00 Model 1