

Answered step by step
Verified Expert Solution
Question
1 Approved Answer
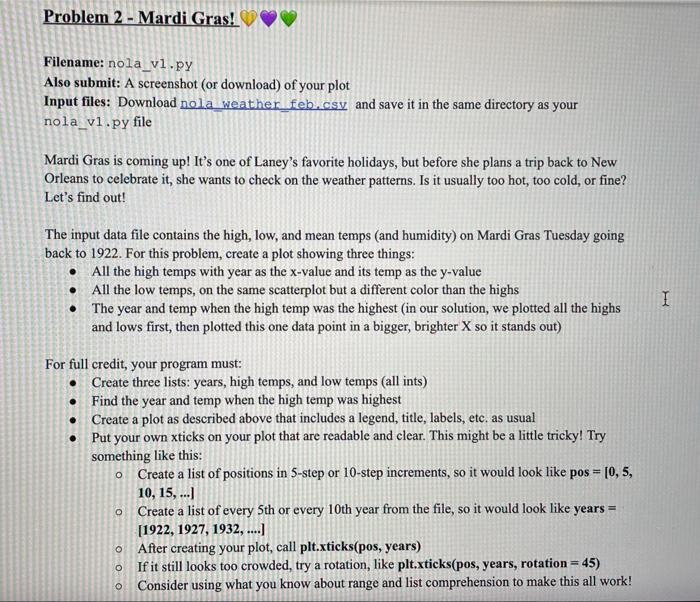
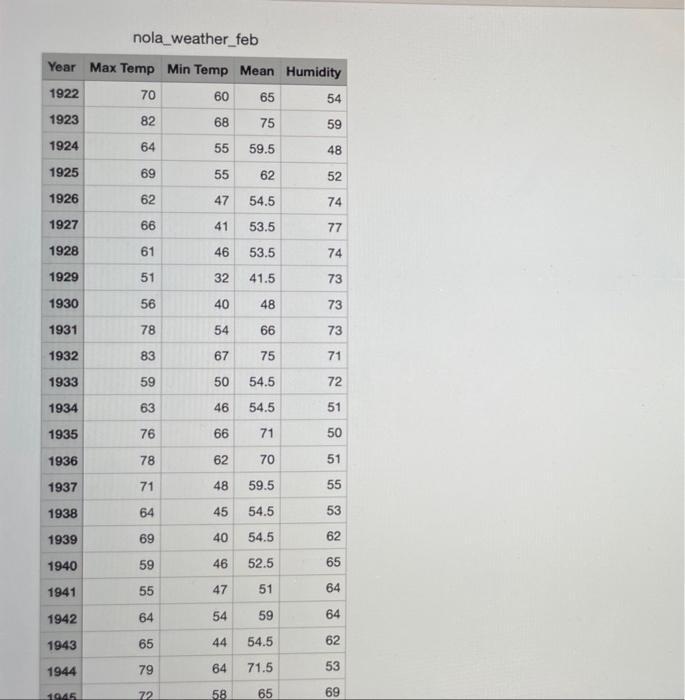
Filename: nola_v1.py Also submit: A screenshot (or download) of your plot Input files: Download nola weather feb.csv and save it in the same directory as
Step by Step Solution
There are 3 Steps involved in it
Step: 1

Get Instant Access to Expert-Tailored Solutions
See step-by-step solutions with expert insights and AI powered tools for academic success
Step: 2

Step: 3
Ace Your Homework with AI
Get the answers you need in no time with our AI-driven, step-by-step assistance
Get Started
Database Design For Mere Mortals
Authors: Michael J Hernandez
4th Edition
978-0136788041