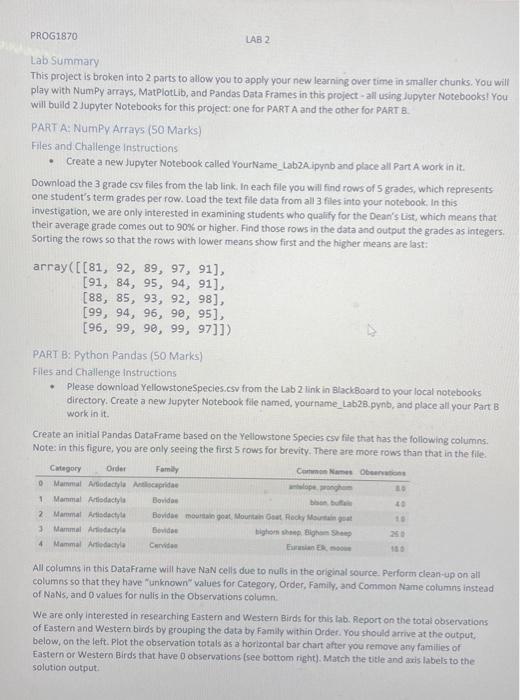
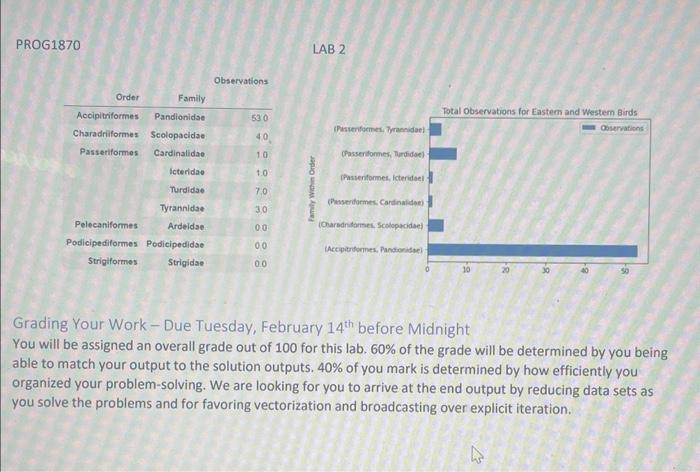
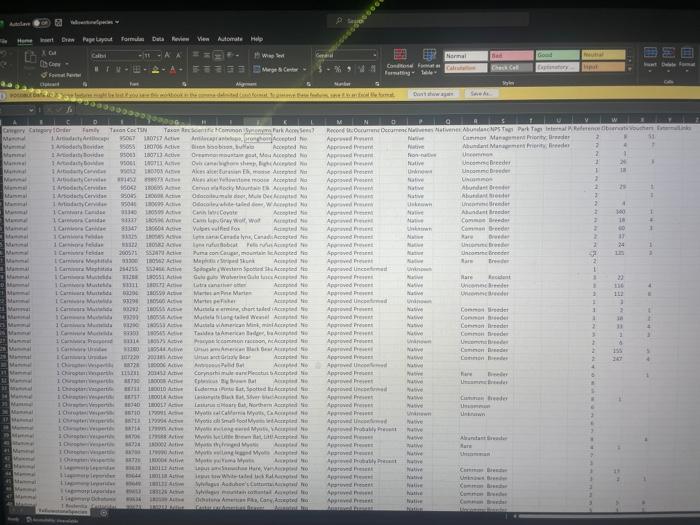
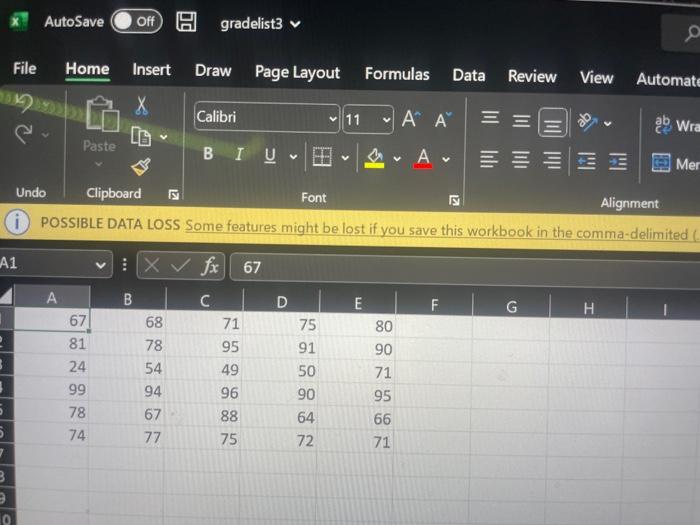
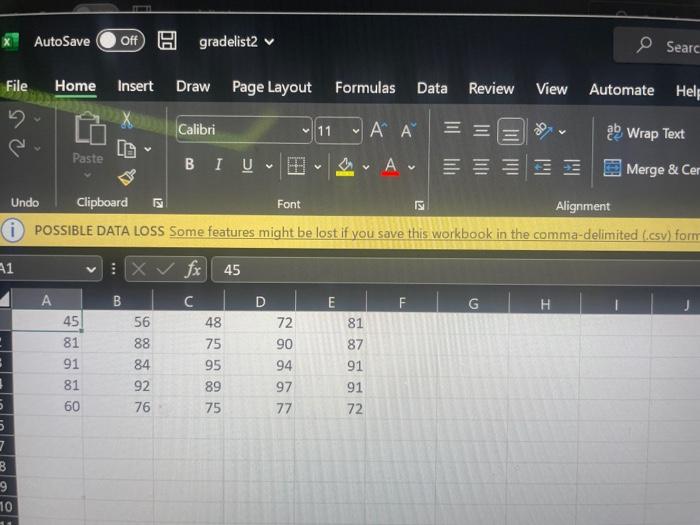
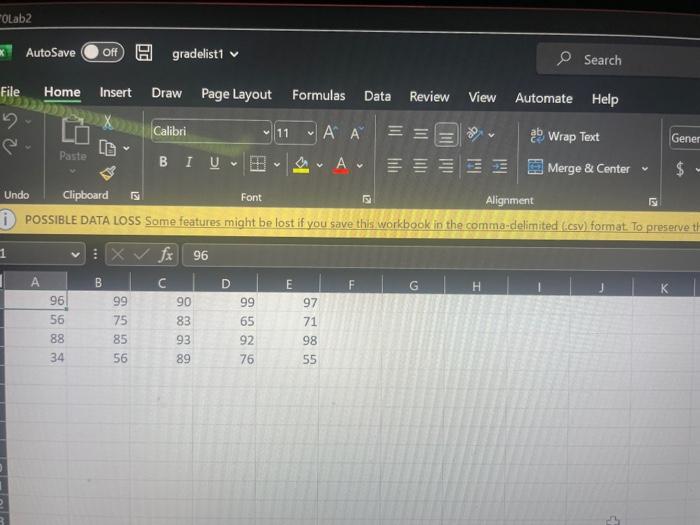
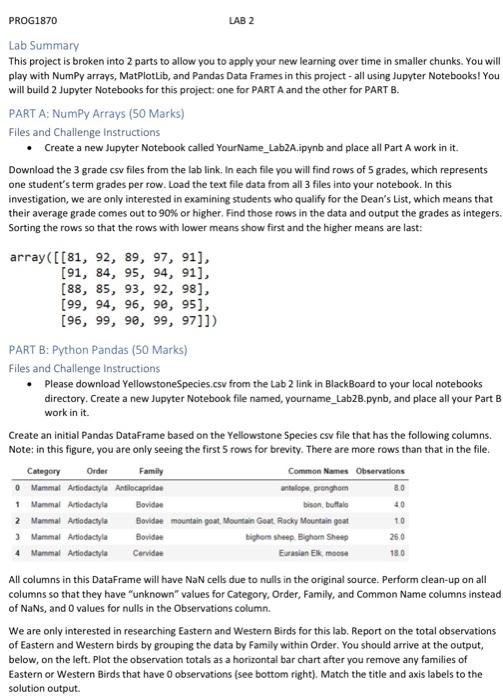
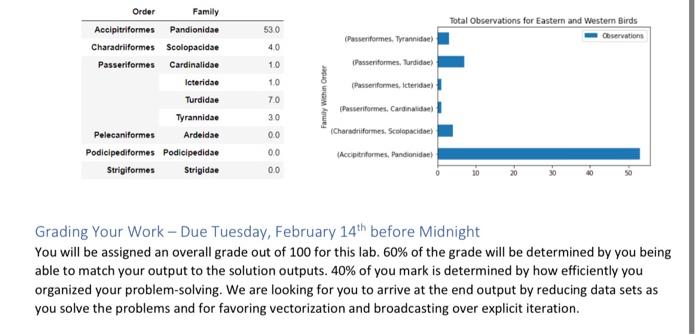
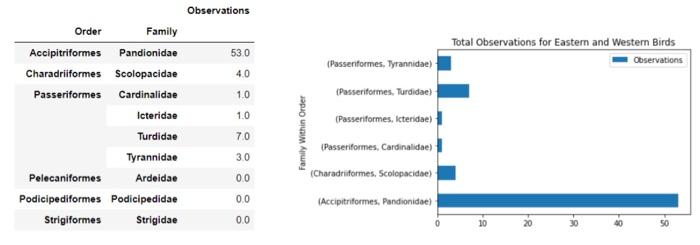
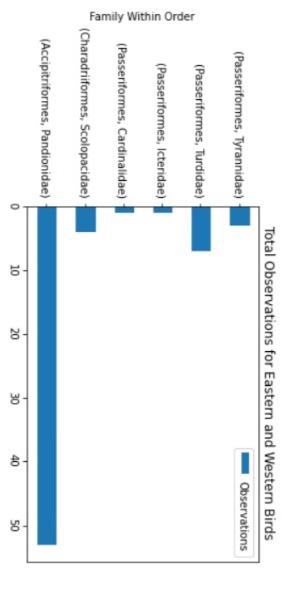
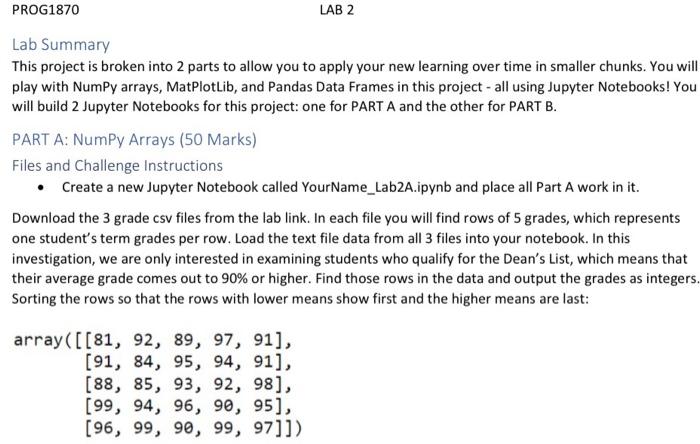
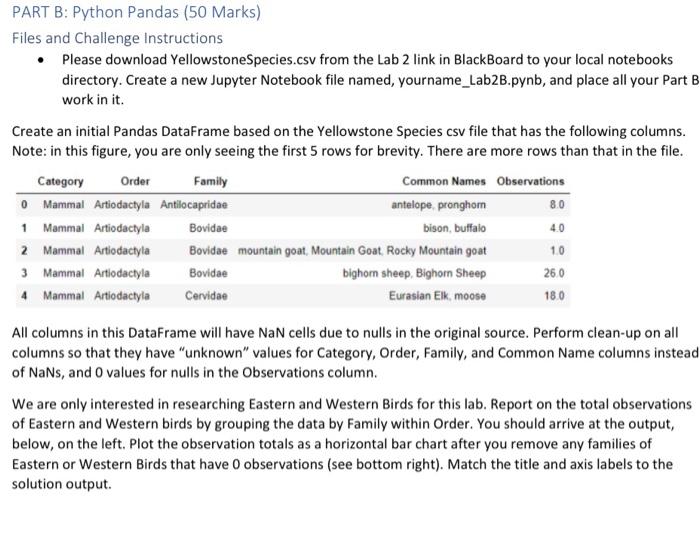
Files and Chailenge Instructions - Create a new Jupyter Notebook called YourName_ LabzA ipyab and place all Part A work in it. Download the 3 grade csv files from the lab link, In each file you will find rows of 5 grades, which represents one student's term grades per row. Load the text file data from all 3 files into your notebook, In this invest igation, we are only interested in examining students who qualify for the Dean's list, which means that their average grade comes out to 900 or higher. Find those rows in the data and output the grades as integers. Sorting the fows so that the rows with lower means show first and the higher means are last: array([[81,92,89,97,91],[91,84,95,94,91][88,85,93,92,98],[99,94,96,98,95],[96,99,96,99,97]]) PARI B: Python Pandas (50 Marks) Files and Challenge Instructions - Please downioad YellowstoneSpecies.csv from the Lab 2 link in BlsckBoard to your local notebooks directory. Create a new lupyter Notebook file named, yourname_Lab28. pynb, and place all your Part B work in it. Create an initial Pandas DataFrame based on the Yellowstone Species cov fite that has the following columns. Note: in this figure, you are only seeing the first 5 rows for brevity. There are moce rows than that in the file. All columns in this Dataframe will have NaN cells due to nulls in the originat source. Perform clean-up on all columns so that they have "unknown" values for Category, Order, Family, and Common Name columns instead of NaNs, and 0 values for nulis in the Observations column. We are only interested in researching Eastern and Western Birds for this lab. Report on the total observations of Eastern and Western birds by grouping the data by Family within Drder. You should arrive at the output. below, on the left. Plot the observation totals as a hoiltontal bar chart after you remove any families of Eastern or Western Birds that have 0 observations (see bottom right). Match the tille and axis labeis to the solution output. PROG 1870 LAB 2 Observations Grading Your Work - Due Tuesday, February 14th before Midnight You will be assigned an overall grade out of 100 for this lab. 60% of the grade will be determined by you being able to match your output to the solution outputs. 40% of you mark is determined by how efficiently you organized your problem-solving. We are looking for you to arrive at the end output by reducing data sets as you solve the problems and for favoring vectorization and broadcasting over explicit iteration. x: AutoSave Ooff [ gradelist3 v (i) POSSIBLE DATA LOSS Some features might be lost if you save this workbook in the comma-delimited A1 fx67 \begin{tabular}{|l|l|l|l|l|l|} \hlineA & B & \multicolumn{1}{|c|}{ C } & D & E & F \\ \hline 67 & 68 & 71 & 75 & 80 \\ \hline 81 & 78 & 95 & 91 & 90 \\ \hline 24 & 54 & 49 & 50 & 71 \\ \hline 99 & 94 & 96 & 90 & 95 \\ \hline 78 & 67 & 88 & 64 & 66 \\ \hline 74 & 77 & 75 & 72 & 71 \\ \hline \end{tabular} X AutoSave Off gradelist 2 (i) POSSIBLE DATA LOSS Some features might be lost if you save this workbook in the comma-delimited (.csv) form OLab2 AutoSave gradelist1 Search File Home Insert Draw Page Layout Formulas Data Review View Automate Help Q. Undo Clipboard Font () Alignent POSSIBLE DATA LOSS Some feature _fx)96 \begin{tabular}{|l|l|l|l|l|} \hlineA & B & C & D & E \\ \hline 96 & 99 & 90 & 99 & 97 \\ \hline 56 & 75 & 83 & 65 & 71 \\ \hline 88 & 85 & 93 & 92 & 98 \\ \hline 34 & 56 & 89 & 76 & 55 \\ \hline \end{tabular} PART B: Python Pandas (50 Marks) Files and Challenge instructions - Please download YellowstoneSpecies.csv from the Lab 2 link in BlackBoard to your local notebooks directory. Create a new Jupyter Notebook file named, yourname_Lab2B.pynb, and place all your Part B work in it. Create an initial Pandas DataFrame based on the Yellowstone Species csv file that has the following columns. Note: in this figure, you are only seeing the first 5 rows for brevity. There are more rows than that in the file. All columns in this DataFrame will have NaN cells due to nulls in the original source. Perform clean-up on all columns so that they have "unknown" values for Category, Order, Family, and Common Name columns instead. of NaNs, and 0 values for nulls in the Observations column. We are only interested in researching Eastern and Western Birds for this lab. Report on the total observations of Eastern and Western birds by grouping the data by Family within Order. You should arrive at the output, below, on the left. Plot the observation totals as a horizontal bar chart after you remove any families of Eastern or Western Birds that have 0 observations (see bottom right). Match the title and axis labels to the solution output. Grading Your Work - Due Tuesday, February 14th before Midnight You will be assigned an overall grade out of 100 for this lab. 60% of the grade will be determined by you being able to match your output to the solution outputs. 40% of you mark is determined by how efficiently you organized your problem-solving. We are looking for you to arrive at the end output by reducing data sets as you solve the problems and for favoring vectorization and broadcasting over explicit iteration. Observations \begin{tabular}{rrr} & Frder & Family \\ \hline Accipitriformes & Pandionidae & 53.0 \\ Charadriformes & Scolopacidae & 4.0 \\ Passeriformes & Cardinalidae & 1.0 \\ & lcteridae & 1.0 \\ & Turdidae & 7.0 \\ & Tyrannidae & 3.0 \\ Pelecaniformes & Ardeidae & 0.0 \\ Podieipediformes & Podicipedidae & 0.0 \\ Strigiformes & Strigidae & 0.0 \end{tabular} Total Observations for Eastem and Western Birds (Passeriformes, Tyrannidae) (Passeriformes, Turdidae) (Passeriformes, Icteridae) (Passeriformes, Cardinalidae) (Charadruformes, Scolopscidae) (Accipitriformes, Pandionidae) Total Observations for Eastern and Western Birds Lab Summary This project is broken into 2 parts to allow you to apply your new learning over time in smaller chunks. You will play with NumPy arrays, MatPlotLib, and Pandas Data Frames in this project - all using Jupyter Notebooks! You will build 2 Jupyter Notebooks for this project: one for PART A and the other for PART B. PART A: NumPy Arrays (50 Marks) Files and Challenge Instructions - Create a new Jupyter Notebook called YourName_Lab2A.ipynb and place all Part A work in it. Download the 3 grade csv files from the lab link. In each file you will find rows of 5 grades, which represents one student's term grades per row. Load the text file data from all 3 files into your notebook. In this investigation, we are only interested in examining students who qualify for the Dean's List, which means that their average grade comes out to 90% or higher. Find those rows in the data and output the grades as integers Sorting the rows so that the rows with lower means show first and the higher means are last: array([81,92,89,97,91][91,84,95,94,91][88,85,93,92,98][99,94,96,90,95][96,99,90,99,97]]) PART B: Python Pandas (50 Marks) Files and Challenge Instructions - Please download YellowstoneSpecies.csv from the Lab 2 link in BlackBoard to your local notebooks directory. Create a new Jupyter Notebook file named, yourname_Lab2B.pynb, and place all your Part B work in it. Create an initial Pandas DataFrame based on the Yellowstone Species csv file that has the following columns. Note: in this figure, you are only seeing the first 5 rows for brevity. There are more rows than that in the file. All columns in this DataFrame will have NaN cells due to nulls in the original source. Perform clean-up on all columns so that they have "unknown" values for Category, Order, Family, and Common Name columns instead of NaNs, and 0 values for nulls in the Observations column. We are only interested in researching Eastern and Western Birds for this lab. Report on the total observations of Eastern and Western birds by grouping the data by Family within Order. You should arrive at the output, below, on the left. Plot the observation totals as a horizontal bar chart after you remove any families of Eastern or Western Birds that have 0 observations (see bottom right). Match the title and axis labels to the solution output. Files and Chailenge Instructions - Create a new Jupyter Notebook called YourName_ LabzA ipyab and place all Part A work in it. Download the 3 grade csv files from the lab link, In each file you will find rows of 5 grades, which represents one student's term grades per row. Load the text file data from all 3 files into your notebook, In this invest igation, we are only interested in examining students who qualify for the Dean's list, which means that their average grade comes out to 900 or higher. Find those rows in the data and output the grades as integers. Sorting the fows so that the rows with lower means show first and the higher means are last: array([[81,92,89,97,91],[91,84,95,94,91][88,85,93,92,98],[99,94,96,98,95],[96,99,96,99,97]]) PARI B: Python Pandas (50 Marks) Files and Challenge Instructions - Please downioad YellowstoneSpecies.csv from the Lab 2 link in BlsckBoard to your local notebooks directory. Create a new lupyter Notebook file named, yourname_Lab28. pynb, and place all your Part B work in it. Create an initial Pandas DataFrame based on the Yellowstone Species cov fite that has the following columns. Note: in this figure, you are only seeing the first 5 rows for brevity. There are moce rows than that in the file. All columns in this Dataframe will have NaN cells due to nulls in the originat source. Perform clean-up on all columns so that they have "unknown" values for Category, Order, Family, and Common Name columns instead of NaNs, and 0 values for nulis in the Observations column. We are only interested in researching Eastern and Western Birds for this lab. Report on the total observations of Eastern and Western birds by grouping the data by Family within Drder. You should arrive at the output. below, on the left. Plot the observation totals as a hoiltontal bar chart after you remove any families of Eastern or Western Birds that have 0 observations (see bottom right). Match the tille and axis labeis to the solution output. PROG 1870 LAB 2 Observations Grading Your Work - Due Tuesday, February 14th before Midnight You will be assigned an overall grade out of 100 for this lab. 60% of the grade will be determined by you being able to match your output to the solution outputs. 40% of you mark is determined by how efficiently you organized your problem-solving. We are looking for you to arrive at the end output by reducing data sets as you solve the problems and for favoring vectorization and broadcasting over explicit iteration. x: AutoSave Ooff [ gradelist3 v (i) POSSIBLE DATA LOSS Some features might be lost if you save this workbook in the comma-delimited A1 fx67 \begin{tabular}{|l|l|l|l|l|l|} \hlineA & B & \multicolumn{1}{|c|}{ C } & D & E & F \\ \hline 67 & 68 & 71 & 75 & 80 \\ \hline 81 & 78 & 95 & 91 & 90 \\ \hline 24 & 54 & 49 & 50 & 71 \\ \hline 99 & 94 & 96 & 90 & 95 \\ \hline 78 & 67 & 88 & 64 & 66 \\ \hline 74 & 77 & 75 & 72 & 71 \\ \hline \end{tabular} X AutoSave Off gradelist 2 (i) POSSIBLE DATA LOSS Some features might be lost if you save this workbook in the comma-delimited (.csv) form OLab2 AutoSave gradelist1 Search File Home Insert Draw Page Layout Formulas Data Review View Automate Help Q. Undo Clipboard Font () Alignent POSSIBLE DATA LOSS Some feature _fx)96 \begin{tabular}{|l|l|l|l|l|} \hlineA & B & C & D & E \\ \hline 96 & 99 & 90 & 99 & 97 \\ \hline 56 & 75 & 83 & 65 & 71 \\ \hline 88 & 85 & 93 & 92 & 98 \\ \hline 34 & 56 & 89 & 76 & 55 \\ \hline \end{tabular} PART B: Python Pandas (50 Marks) Files and Challenge instructions - Please download YellowstoneSpecies.csv from the Lab 2 link in BlackBoard to your local notebooks directory. Create a new Jupyter Notebook file named, yourname_Lab2B.pynb, and place all your Part B work in it. Create an initial Pandas DataFrame based on the Yellowstone Species csv file that has the following columns. Note: in this figure, you are only seeing the first 5 rows for brevity. There are more rows than that in the file. All columns in this DataFrame will have NaN cells due to nulls in the original source. Perform clean-up on all columns so that they have "unknown" values for Category, Order, Family, and Common Name columns instead. of NaNs, and 0 values for nulls in the Observations column. We are only interested in researching Eastern and Western Birds for this lab. Report on the total observations of Eastern and Western birds by grouping the data by Family within Order. You should arrive at the output, below, on the left. Plot the observation totals as a horizontal bar chart after you remove any families of Eastern or Western Birds that have 0 observations (see bottom right). Match the title and axis labels to the solution output. Grading Your Work - Due Tuesday, February 14th before Midnight You will be assigned an overall grade out of 100 for this lab. 60% of the grade will be determined by you being able to match your output to the solution outputs. 40% of you mark is determined by how efficiently you organized your problem-solving. We are looking for you to arrive at the end output by reducing data sets as you solve the problems and for favoring vectorization and broadcasting over explicit iteration. Observations \begin{tabular}{rrr} & Frder & Family \\ \hline Accipitriformes & Pandionidae & 53.0 \\ Charadriformes & Scolopacidae & 4.0 \\ Passeriformes & Cardinalidae & 1.0 \\ & lcteridae & 1.0 \\ & Turdidae & 7.0 \\ & Tyrannidae & 3.0 \\ Pelecaniformes & Ardeidae & 0.0 \\ Podieipediformes & Podicipedidae & 0.0 \\ Strigiformes & Strigidae & 0.0 \end{tabular} Total Observations for Eastem and Western Birds (Passeriformes, Tyrannidae) (Passeriformes, Turdidae) (Passeriformes, Icteridae) (Passeriformes, Cardinalidae) (Charadruformes, Scolopscidae) (Accipitriformes, Pandionidae) Total Observations for Eastern and Western Birds Lab Summary This project is broken into 2 parts to allow you to apply your new learning over time in smaller chunks. You will play with NumPy arrays, MatPlotLib, and Pandas Data Frames in this project - all using Jupyter Notebooks! You will build 2 Jupyter Notebooks for this project: one for PART A and the other for PART B. PART A: NumPy Arrays (50 Marks) Files and Challenge Instructions - Create a new Jupyter Notebook called YourName_Lab2A.ipynb and place all Part A work in it. Download the 3 grade csv files from the lab link. In each file you will find rows of 5 grades, which represents one student's term grades per row. Load the text file data from all 3 files into your notebook. In this investigation, we are only interested in examining students who qualify for the Dean's List, which means that their average grade comes out to 90% or higher. Find those rows in the data and output the grades as integers Sorting the rows so that the rows with lower means show first and the higher means are last: array([81,92,89,97,91][91,84,95,94,91][88,85,93,92,98][99,94,96,90,95][96,99,90,99,97]]) PART B: Python Pandas (50 Marks) Files and Challenge Instructions - Please download YellowstoneSpecies.csv from the Lab 2 link in BlackBoard to your local notebooks directory. Create a new Jupyter Notebook file named, yourname_Lab2B.pynb, and place all your Part B work in it. Create an initial Pandas DataFrame based on the Yellowstone Species csv file that has the following columns. Note: in this figure, you are only seeing the first 5 rows for brevity. There are more rows than that in the file. All columns in this DataFrame will have NaN cells due to nulls in the original source. Perform clean-up on all columns so that they have "unknown" values for Category, Order, Family, and Common Name columns instead of NaNs, and 0 values for nulls in the Observations column. We are only interested in researching Eastern and Western Birds for this lab. Report on the total observations of Eastern and Western birds by grouping the data by Family within Order. You should arrive at the output, below, on the left. Plot the observation totals as a horizontal bar chart after you remove any families of Eastern or Western Birds that have 0 observations (see bottom right). Match the title and axis labels to the solution output
