Answered step by step
Verified Expert Solution
Question
1 Approved Answer
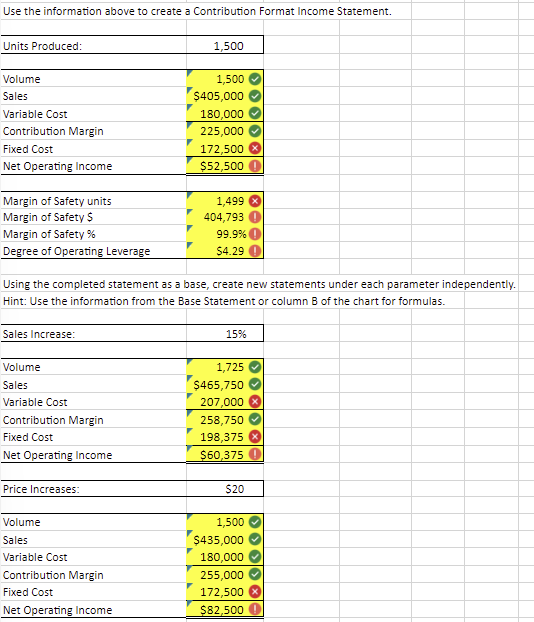
Fill in and show formulas for all the cells in yellow. Use the information above to create a Contribution Format Income Statement. begin{tabular}{lr|} hline Units
- Fill in and show formulas for all the cells in yellow.


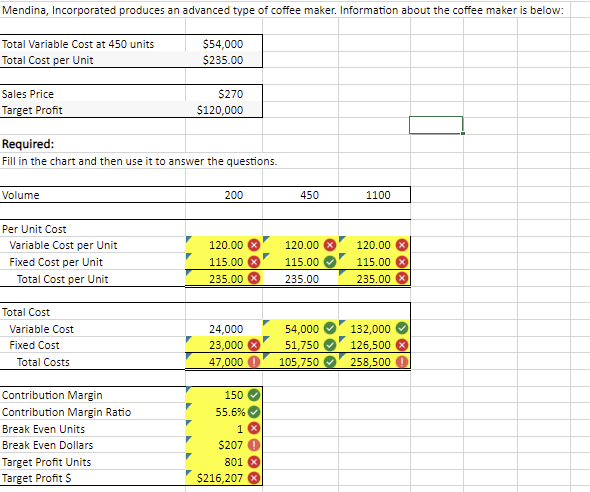
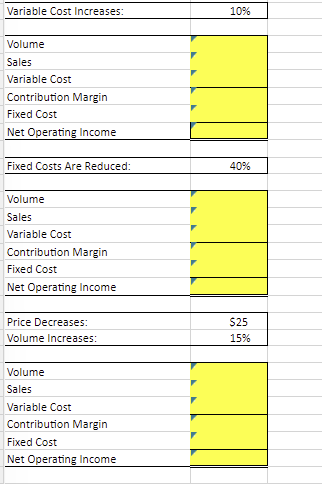
 Use the information above to create a Contribution Format Income Statement. \begin{tabular}{lr|} \hline Units Produced: & \multicolumn{1}{c|}{1,500} \\ \hline & 1,500 \\ \hline Volume & $405,000 \\ \hline Sales & 180,000 \\ \hline Variable Cost & 225,000 \\ \hline Contribution Margin & 172,500 \\ \hline Fixed Cost & $52,500 \\ \hline Net Operating Income & \\ \hline \end{tabular} Using the completed statement as a base, create new statements under each parameter independently. Hint: Use the information from the Base Statement or column B of the chart for formulas. \begin{tabular}{|c|c|} \hline Sales Increase: & 15% \\ \hline Volume & 1,725 \\ \hline Sales & T$465,750 \\ \hline Variable Cost & 207,000 \\ \hline Contribution Margin & 258,750 \\ \hline Fixed Cost & 198,375 \\ \hline Net Operating Income & $60,375( \\ \hline \end{tabular} \begin{tabular}{l|l} \hline Price Increases: & $20 \\ \hline \end{tabular} Volume Sales Variable Cost Contribution Margin Fixed Cost Net Operating Income 1,500 $435,000 180,000 255,000 172,500 $82,5000 \begin{tabular}{l|} \hline Variable Cost Increases: \\ \hline Volume \\ \hline Sales \\ \hline Variable Cost \\ \hline Contribution Margin \\ \hline Fixed Cost \\ \hline Net Operating Income \\ \hline \\ \hline Fixed Costs Are Reduced: \\ \hline \\ \hline Volume \\ \hline Sales \\ \hline Variable Cost \\ \hline Contribution Margin \\ \hline Fixed Cost \\ \hline Net Operating Income \\ \hline \\ \hline Price Decreases: \\ \hline Volume Increases: \\ \hline Volume \\ \hline Sales \\ \hline Variable Cost \\ \hline Nontribution Margin \\ \hline \end{tabular} Mendina, Incorporated produces an advanced type of coffee maker. Information about the coffee maker is below: Total Variable Cost at 450 units Total Cost per Unit \begin{tabular}{l|r|} \hline Total Cost per Unit & $235.00 \\ \hline & \\ \hline Sales Price & $270 \\ Target Profit & $120,000 \\ \hline & \\ \hline Required: & \\ \hline \end{tabular} Fill in the chart and then use it to answer the questions. \begin{tabular}{|c|c|c|c|} \hline Volume & 200 & 450 & 1100 \\ \hline \multicolumn{4}{|l|}{ Per Unit Cost } \\ \hline Variable Cost per Unit & 120.00 & 120.00 & 120.00 \\ \hline Fixed Cost per Unit & 115.00 & 115.00 & 115.00 \\ \hline Total Cost per Unit & 235.00 & 235.00 & 235.00 \\ \hline \multicolumn{4}{|l|}{ Total Cost } \\ \hline Variable cost & 24,000 & 54,000 & 132,000 \\ \hline Fixed Cost & 23,000 & 51,750 & 126,500 \\ \hline Total Costs & 47,0000 & 105,750Q & 258,500 \\ \hline Contribution Margin & 1500 & & \\ \hline Contribution Margin Ratio & 55.6% & & \\ \hline Break Even Units & 1 & & \\ \hline Break Even Dollars & $207 (1) & & \\ \hline Target Profit Units & 801 & & \\ \hline Target Profit $ & $216,207 & & \\ \hline \end{tabular}
 Step by Step Solution
There are 3 Steps involved in it
Step: 1

Get Instant Access to Expert-Tailored Solutions
See step-by-step solutions with expert insights and AI powered tools for academic success
Step: 2

Step: 3

Ace Your Homework with AI
Get the answers you need in no time with our AI-driven, step-by-step assistance
Get Started


