Answered step by step
Verified Expert Solution
Question
1 Approved Answer
Fill in the blanks in the chart below: Year Years since 1960 1960 1965 1970 1975 1980 1985 1990 1995 1996 1997 1998 1999
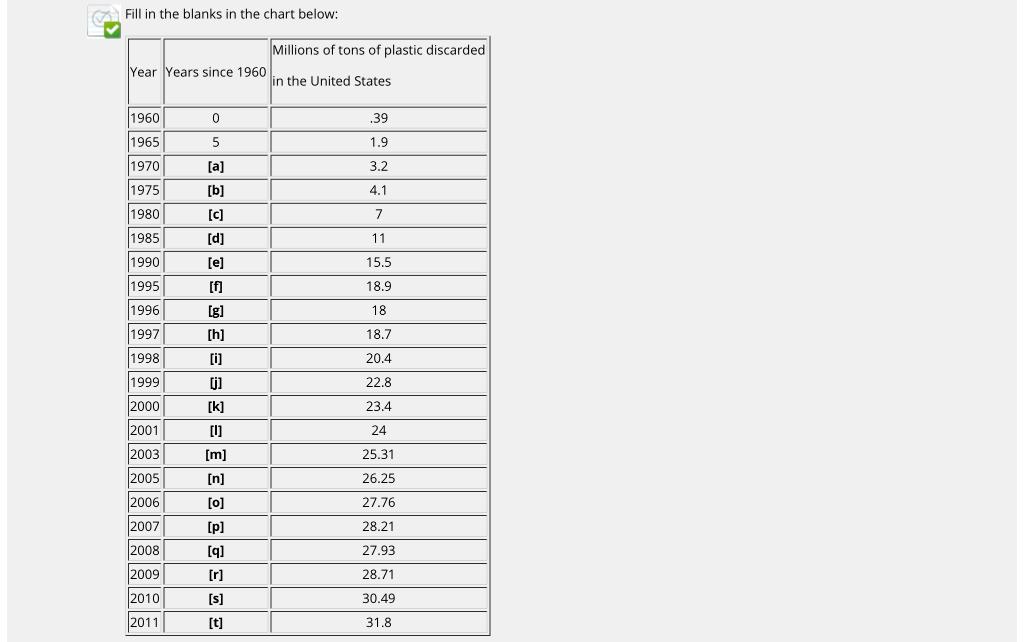
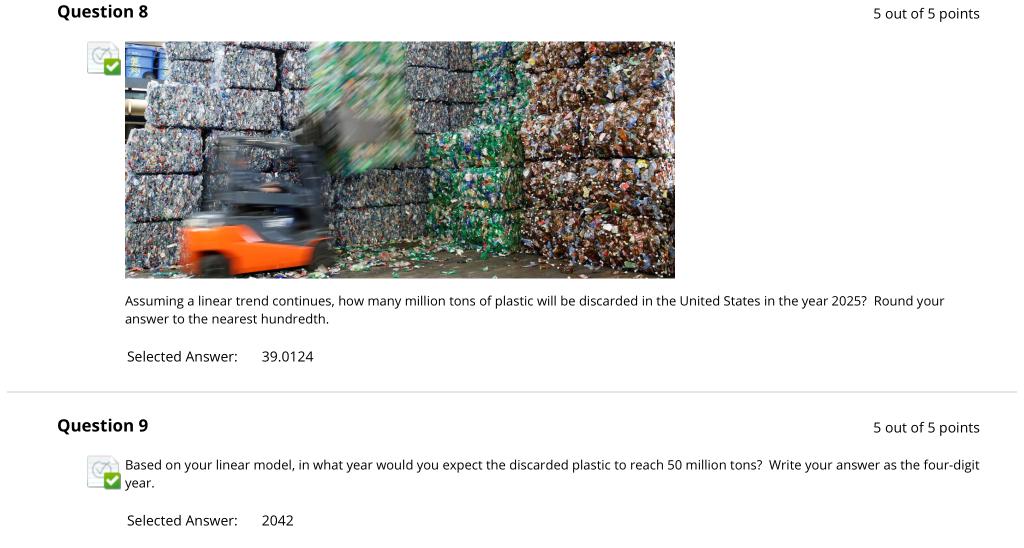
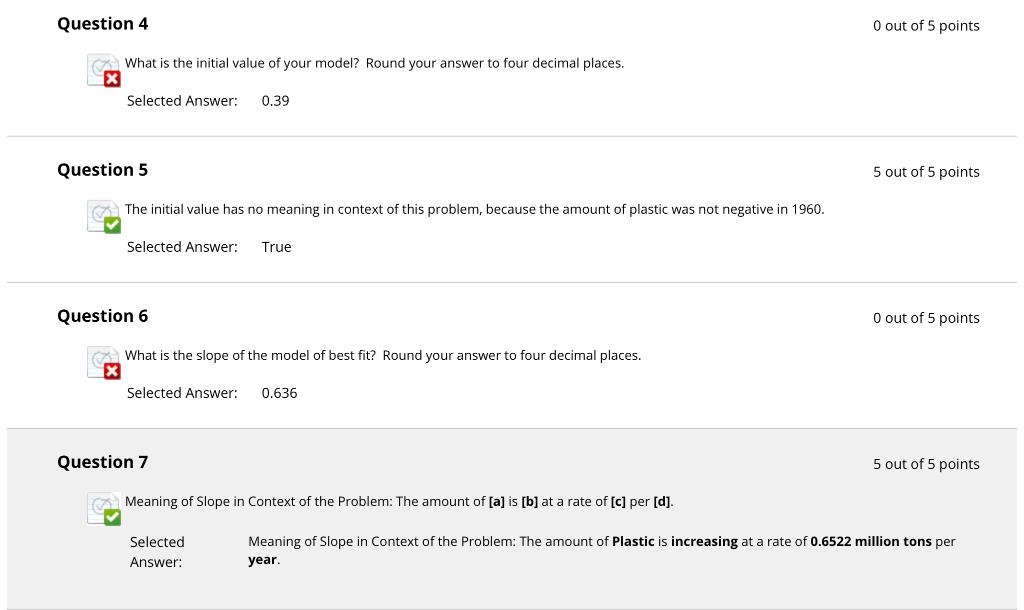
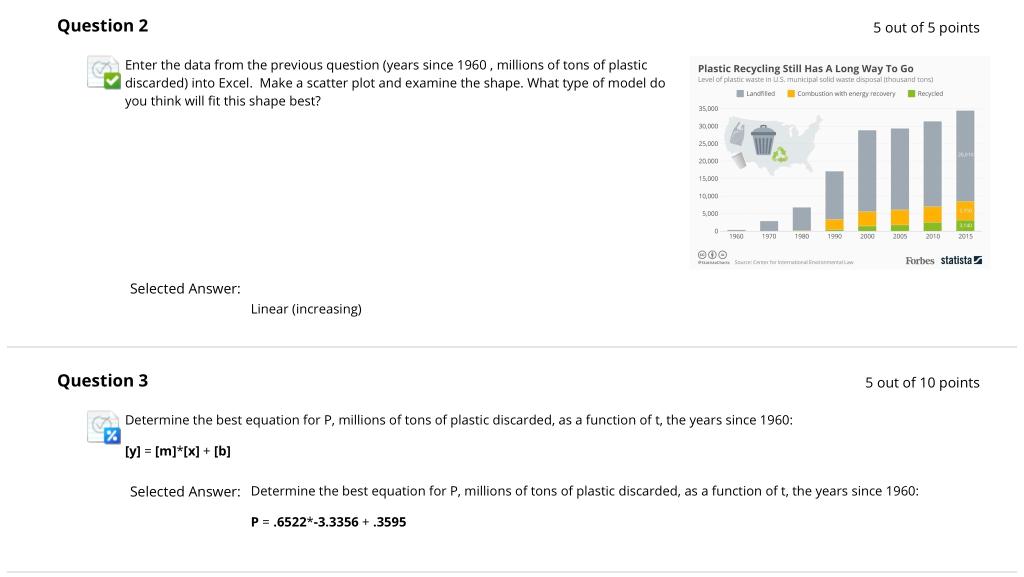
Fill in the blanks in the chart below: Year Years since 1960 1960 1965 1970 1975 1980 1985 1990 1995 1996 1997 1998 1999 2000 2001 2003 2005 2006 2007 2008 2009 2010 2011 0 5 [a] [b] [c] [d] [e] [f] [g] [h] [i] [j] [k] [U] [m] [n] [0] [p] [q] [s] [t] Millions of tons of plastic discarded in the United States .39 1.9 3.2 4.1 7 11 15.5 18.9 18 18.7 20.4 22.8 23.4 24 25.31 26.25 27.76 28.21 27.93 28.71 30.49 31.8 Question 8 5 out of 5 points Assuming a linear trend continues, how many million tons of plastic will be discarded in the United States in the year 2025? Round your answer to the nearest hundredth. Selected Answer: 39.0124 Question 9 5 out of 5 points Based on your linear model, in what year would you expect the discarded plastic to reach 50 million tons? Write your answer as the four-digit year. Selected Answer: 2042 Question 4 What is the initial value of your model? Round your answer to four decimal places. X Selected Answer: 0.39 Question 5 The initial value has no meaning in context of this problem, because the amount of plastic was not negative in 1960. Selected Answer: True Question 6 What is the slope of the model of best fit? Round your answer to four decimal places. X Selected Answer: Question 7 0.636 Meaning of Slope in Context of the Problem: The amount of [a] is [b] at a rate of [c] per [d]. Selected Answer: 0 out of 5 points 5 out of 5 points 0 out of 5 points 5 out of 5 points Meaning of Slope in Context of the Problem: The amount of Plastic is increasing at a rate of 0.6522 million tons per year. Question 2 Enter the data from the previous question (years since 1960, millions of tons of plastic discarded) into Excel. Make a scatter plot and examine the shape. What type of model do you think will fit this shape best? Selected Answer: Question 3 Linear (increasing) Plastic Recycling Still Has A Long Way To Go Level of plastic waste in US, municipal solid waste disposal thousand tons) Landled Combustion with energy recovery Recycled 35,000 P = .6522*-3.3356 +3595 30,000 25,000 20,000 15,000 10,000 5,000 0 00 1960 1970 Determine the best equation for P, millions of tons of plastic discarded, as a function of t, the years since 1960: [y] = [m]*[x] + [b] 1980 5 out of 5 points 1990 2000 2005 2010 201 Selected Answer: Determine the best equation for P, millions of tons of plastic discarded, as a function of t, the years since 1960: LPW Ara 2015 Forbes statista 5 out of 10 points
Step by Step Solution
★★★★★
3.40 Rating (156 Votes )
There are 3 Steps involved in it
Step: 1

Get Instant Access to Expert-Tailored Solutions
See step-by-step solutions with expert insights and AI powered tools for academic success
Step: 2

Step: 3

Ace Your Homework with AI
Get the answers you need in no time with our AI-driven, step-by-step assistance
Get Started


