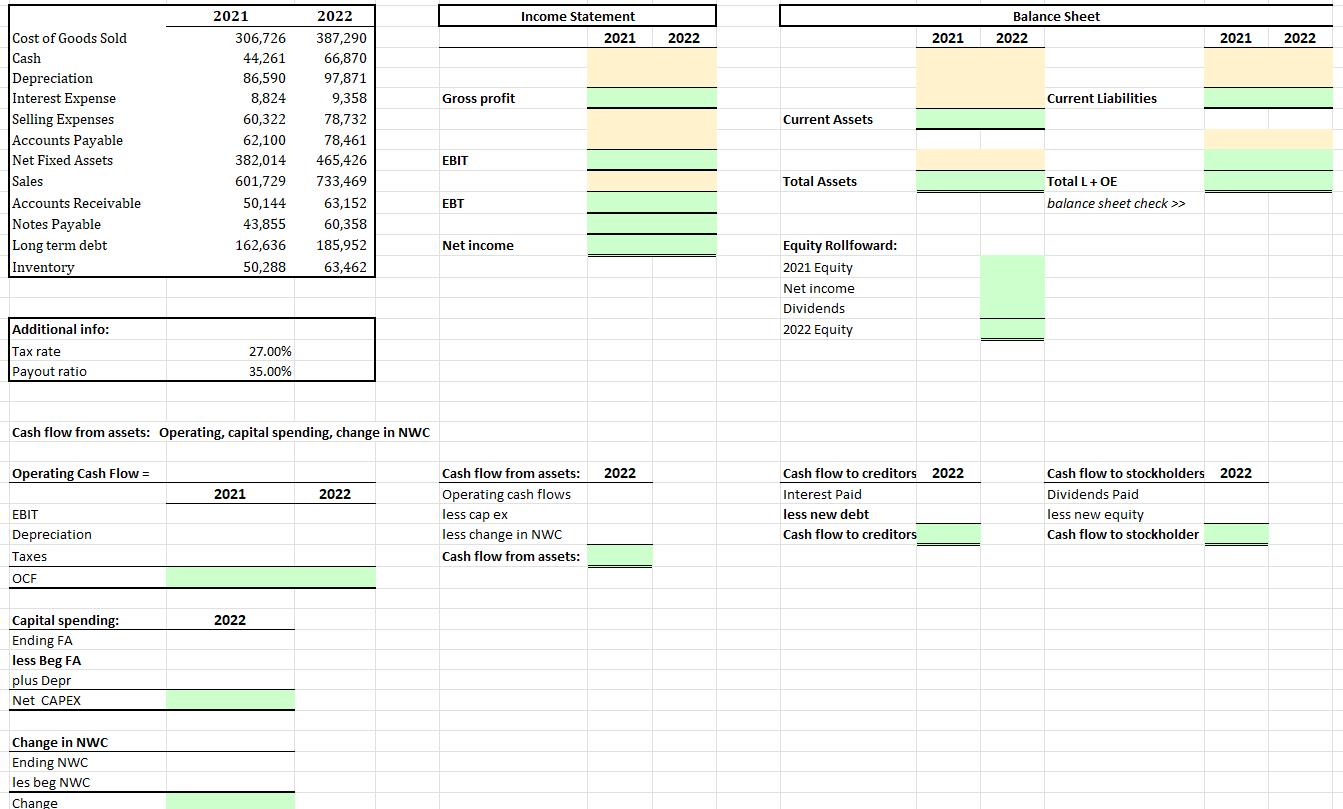
Fill in the chart and answer questions: Cost of Goods Sold Cash Depreciation Interest Expense Selling Expenses Accounts Payable Net Fixed Assets Sales Accounts Receivable

Cost of Goods Sold Cash Depreciation Interest Expense Selling Expenses Accounts Payable Net Fixed Assets Sales Accounts Receivable Notes Payable Long term debt Inventory Additional info: Tax rate Payout ratio EBIT Depreciation Taxes OCF Capital spending: Ending FA less Beg FA plus Depr Net CAPEX 2021 Change in NWC Ending NWC les beg NWC Change 306,726 44,261 86,590 8,824 60,322 62,100 382,014 601,729 50,144 43,855 162,636 50,288 Cash flow from assets: Operating, capital spending, change in NWC Operating Cash Flow = 2021 27.00% 35.00% 2022 2022 387,290 66,870 97,871 9,358 78,732 78,461 465,426 733,469 63,152 60,358 185,952 63,462 2022 Gross profit EBIT EBT Net income Income Statement Cash flow from assets: Operating cash flows less cap ex less change in NWC Cash flow from assets: 2021 2022 2022 Current Assets Total Assets Equity Rollfoward: 2021 Equity Net income Dividends 2022 Equity 2021 Cash flow to creditors 2022 Interest Paid less new debt Cash flow to creditors Balance Sheet 2022 Current Liabilities Total L + OE balance sheet check >> 2021 Cash flow to stockholders 2022 Dividends Paid less new equity Cash flow to stockholder 2022
Step by Step Solution
3.40 Rating (166 Votes )
There are 3 Steps involved in it
Step: 1
Here is the chart filled out with the information provided Income Statement Sales 601729 733469 Cost ...
See step-by-step solutions with expert insights and AI powered tools for academic success
Step: 2

Step: 3

Ace Your Homework with AI
Get the answers you need in no time with our AI-driven, step-by-step assistance
Get Started


