Answered step by step
Verified Expert Solution
Question
1 Approved Answer
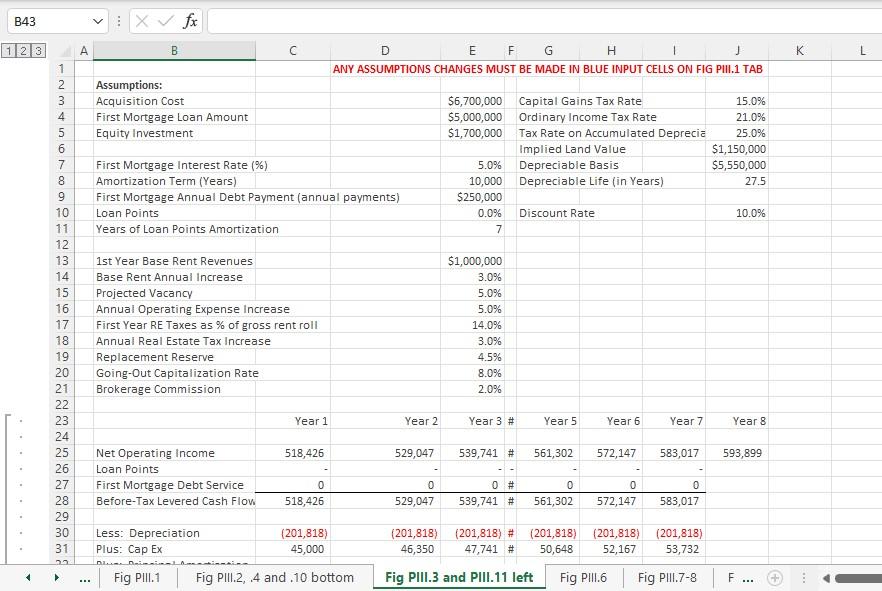
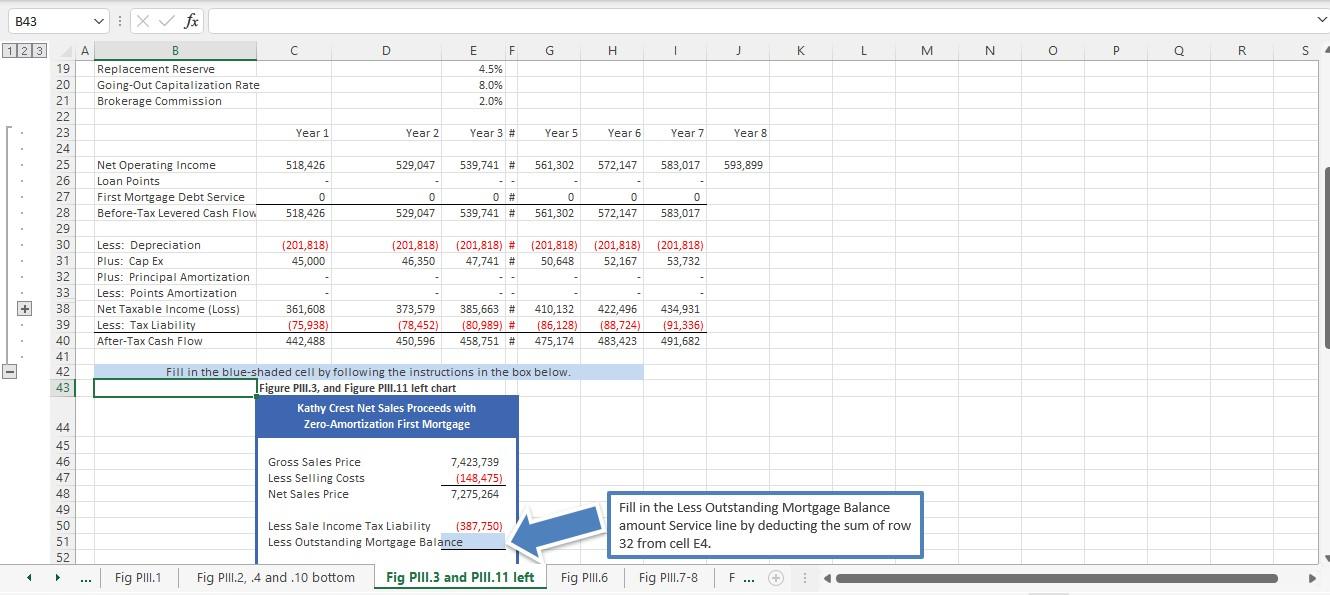
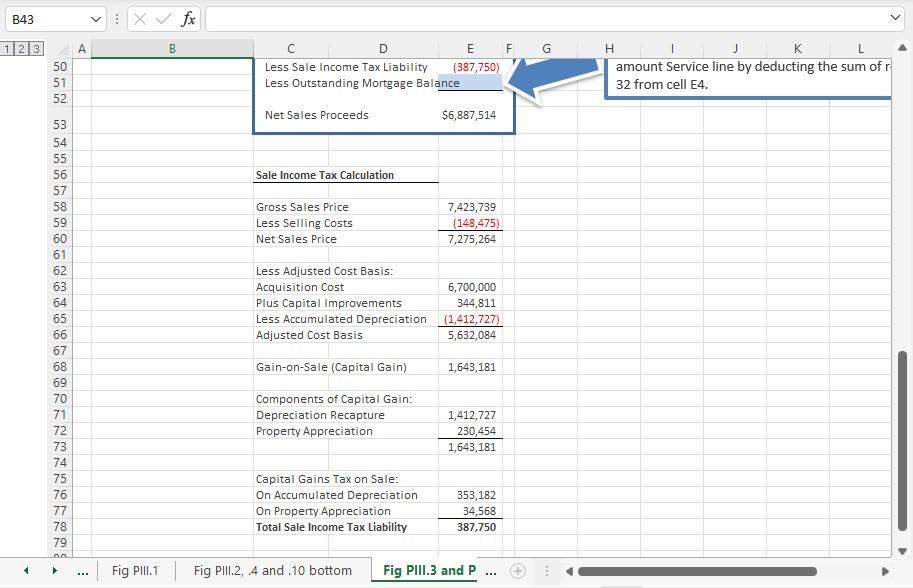
Fill in the Less Outstanding Mortgage Balance amount Service line by deducting the sum of row 32 from cell E4. B43 123 A B C


Fill in the Less Outstanding Mortgage Balance amount Service line by deducting the sum of row 32 from cell E4.
B43 123 A B C D K L E F G H ANY ASSUMPTIONS CHANGES MUST BE MADE IN BLUE INPUT CELLS ON FIG PII.1 TAB Assumptions: Acquisition Cost First Mortgage Loan Amount Equity Investment Nm to 00 OO First Mortgage Interest Rate (%) Amortization Term (Years) First Mortgage Annual Debt Payment (annual payments) Loan Points Years of Loan Points Amortization $6,700,000 Capital Gains Tax Rate 15.0% $5,000,000 Ordinary Income Tax Rate 21.0% $1,700,000 Tax Rate on Accumulated Deprecia 25.0% Implied Land Value $1,150,000 5.0% Depreciable Basis $5,550,000 10,000 Depreciable Life (in Years) 27.5 $250,000 0.0% Discount Rate 10.0% 7 2 3 4 5 6 7 8 9 10 11 12 13 14 15 16 17 18 19 20 21 22 23 24 25 26 27 28 29 30 31 1st Year Base Rent Revenues Base Rent Annual Increase Projected Vacancy Annual Operating Expense Increase First Year RE Taxes as % of gross rent roll Annual Real Estate Tax Increase Replacement Reserve Going Out Capitalization Rate Brokerage Commission $1,000,000 3.0% 5.0% 5.0% 14.0% 3.0% 4.5% 8.0% 2.0% Year 1 Year 2 Year 3 # Year 5 Year 6 Year 7 Year 8 518,426 529,047 539,741 # 561,302 572,147 583,017 593,899 Net Operating Income Loan Points First Mortgage Debt Service Before-Tax Levered Cash Flow 0# 0 518,426 0 529,047 0 561,302 0 572,147 0 583,017 539,741 # (201,818) 46,350 (201,818) # 47,741 # (201,818) 50,648 (201,818) (201,818) 52,167 53,732 Less: Depreciation (201,818) Plus: Cap Ex 45,000 Fig PIll.1 Fig PIll.2, .4 and 10 bottom Fig PIII.3 and PIII.11 left Fig PII. Fig P1.7-8 LL LIE + A B43 XV fx 1 2 3 D F G . 1 K L M N 0 P R S S 19 20 21 22 23 B Replacement Reserve Going Out Capitalization Rate Brokerage Commission E 4.5% 8.0% 2.0% Year 1 Year 2 Year 3 # Year 5 Year 6 Year 7 Year 8 24 25 518,426 529,047 539,741 # 561,302 572,147 583,017 593,899 Net Operating Income Loan Points First Mortgage Debt Service Before-Tax Levered Cash Flow 0 0 518,426 0 529,047 0# 539,741 # 0 561,302 0 583,017 572,147 (201,818) 45,000 (201,818) 46,350 (201,818) # 47,741# (201,818) 50,648 (201,818) 52,167 (201,818) 53,732 26 27 28 29 30 31 32 33 38 39 40 41 42 43 Less: Depreciation Plus: Cap Ex Plus: Principal Amortization Less Points Amortization Net Taxable income (Loss) Less: Tax Liability After-Tax Cash Flow - + 361,608 (75,938) 442,488 373,579 (78,452) 450,596 385,663# (80,989) # 458,751 # 410,132 (86,128) 475,174 422,496 (88,724) 483,423 434,931 (91,336) 491,682 - Fill in the blue-shaded cell by following the instructions in the box below Figure PIM.3, and Figure PIII.11 left chart Kathy Crest Net Sales Proceeds with Zero-Amortization First Mortgage 44 45 46 47 44 48 49 50 51 52 Gross Sales Price Less Selling Costs Net Sales Price 7,423,739 (148,475) 7,275,264 Less Sale Income Tax Liability (387,750) Less Outstanding Mortgage Balance Fill in the Less Outstanding Mortgage Balance amount Service line by deducting the sum of row 32 from cell E4. Fig PIII.1 Fig PIII.2, 4 and 10 bottom Fig PIII.3 and PIII.11 left Fig PII. Fig PIll. 7-8 F... + B43 IX fx A A B G 123 50 51 52 D E F Less Sale Income Tax Liability (387,750) Less Outstanding Mortgage Balance H K amount Service line by deducting the sum ofr 32 from cell E4. Net Sales Proceeds $6,887,514 Sale Income Tax Calculation Gross Sales Price Less Selling Costs Net Sales Price 7,423,739 (148,475) 7,275,264 53 54 55 56 57 58 59 60 61 62 63 64 65 66 67 68 69 70 71 72 73 74 75 76 77 78 79 DUNWS88 9888898% UX 980 Less Adjusted Cost Basis: Acquisition Cost 6,700,000 Plus Capital Improvements 344,811 Less Accumulated Depreciation (1,412,727) Adjusted Cost Basis 5,632,084 Gain-on-Sale (Capital Gain) 1,643,181 Components of Capital Gain: Depreciation Recapture Property Appreciation 1,412,727 230,454 1,643,181 Capital Gains Tax on Sale: On Accumulated Depreciation On Property Appreciation Total Sale Income Tax Liability 353,182 34,568 387,750 OO Fig PIII.1 Fig PIII.2, 4 and 10 bottom Fig PIII.3 and P B43 123 A B C D K L E F G H ANY ASSUMPTIONS CHANGES MUST BE MADE IN BLUE INPUT CELLS ON FIG PII.1 TAB Assumptions: Acquisition Cost First Mortgage Loan Amount Equity Investment Nm to 00 OO First Mortgage Interest Rate (%) Amortization Term (Years) First Mortgage Annual Debt Payment (annual payments) Loan Points Years of Loan Points Amortization $6,700,000 Capital Gains Tax Rate 15.0% $5,000,000 Ordinary Income Tax Rate 21.0% $1,700,000 Tax Rate on Accumulated Deprecia 25.0% Implied Land Value $1,150,000 5.0% Depreciable Basis $5,550,000 10,000 Depreciable Life (in Years) 27.5 $250,000 0.0% Discount Rate 10.0% 7 2 3 4 5 6 7 8 9 10 11 12 13 14 15 16 17 18 19 20 21 22 23 24 25 26 27 28 29 30 31 1st Year Base Rent Revenues Base Rent Annual Increase Projected Vacancy Annual Operating Expense Increase First Year RE Taxes as % of gross rent roll Annual Real Estate Tax Increase Replacement Reserve Going Out Capitalization Rate Brokerage Commission $1,000,000 3.0% 5.0% 5.0% 14.0% 3.0% 4.5% 8.0% 2.0% Year 1 Year 2 Year 3 # Year 5 Year 6 Year 7 Year 8 518,426 529,047 539,741 # 561,302 572,147 583,017 593,899 Net Operating Income Loan Points First Mortgage Debt Service Before-Tax Levered Cash Flow 0# 0 518,426 0 529,047 0 561,302 0 572,147 0 583,017 539,741 # (201,818) 46,350 (201,818) # 47,741 # (201,818) 50,648 (201,818) (201,818) 52,167 53,732 Less: Depreciation (201,818) Plus: Cap Ex 45,000 Fig PIll.1 Fig PIll.2, .4 and 10 bottom Fig PIII.3 and PIII.11 left Fig PII. Fig P1.7-8 LL LIE + A B43 XV fx 1 2 3 D F G . 1 K L M N 0 P R S S 19 20 21 22 23 B Replacement Reserve Going Out Capitalization Rate Brokerage Commission E 4.5% 8.0% 2.0% Year 1 Year 2 Year 3 # Year 5 Year 6 Year 7 Year 8 24 25 518,426 529,047 539,741 # 561,302 572,147 583,017 593,899 Net Operating Income Loan Points First Mortgage Debt Service Before-Tax Levered Cash Flow 0 0 518,426 0 529,047 0# 539,741 # 0 561,302 0 583,017 572,147 (201,818) 45,000 (201,818) 46,350 (201,818) # 47,741# (201,818) 50,648 (201,818) 52,167 (201,818) 53,732 26 27 28 29 30 31 32 33 38 39 40 41 42 43 Less: Depreciation Plus: Cap Ex Plus: Principal Amortization Less Points Amortization Net Taxable income (Loss) Less: Tax Liability After-Tax Cash Flow - + 361,608 (75,938) 442,488 373,579 (78,452) 450,596 385,663# (80,989) # 458,751 # 410,132 (86,128) 475,174 422,496 (88,724) 483,423 434,931 (91,336) 491,682 - Fill in the blue-shaded cell by following the instructions in the box below Figure PIM.3, and Figure PIII.11 left chart Kathy Crest Net Sales Proceeds with Zero-Amortization First Mortgage 44 45 46 47 44 48 49 50 51 52 Gross Sales Price Less Selling Costs Net Sales Price 7,423,739 (148,475) 7,275,264 Less Sale Income Tax Liability (387,750) Less Outstanding Mortgage Balance Fill in the Less Outstanding Mortgage Balance amount Service line by deducting the sum of row 32 from cell E4. Fig PIII.1 Fig PIII.2, 4 and 10 bottom Fig PIII.3 and PIII.11 left Fig PII. Fig PIll. 7-8 F... + B43 IX fx A A B G 123 50 51 52 D E F Less Sale Income Tax Liability (387,750) Less Outstanding Mortgage Balance H K amount Service line by deducting the sum ofr 32 from cell E4. Net Sales Proceeds $6,887,514 Sale Income Tax Calculation Gross Sales Price Less Selling Costs Net Sales Price 7,423,739 (148,475) 7,275,264 53 54 55 56 57 58 59 60 61 62 63 64 65 66 67 68 69 70 71 72 73 74 75 76 77 78 79 DUNWS88 9888898% UX 980 Less Adjusted Cost Basis: Acquisition Cost 6,700,000 Plus Capital Improvements 344,811 Less Accumulated Depreciation (1,412,727) Adjusted Cost Basis 5,632,084 Gain-on-Sale (Capital Gain) 1,643,181 Components of Capital Gain: Depreciation Recapture Property Appreciation 1,412,727 230,454 1,643,181 Capital Gains Tax on Sale: On Accumulated Depreciation On Property Appreciation Total Sale Income Tax Liability 353,182 34,568 387,750 OO Fig PIII.1 Fig PIII.2, 4 and 10 bottom Fig PIII.3 and PStep by Step Solution
There are 3 Steps involved in it
Step: 1

Get Instant Access to Expert-Tailored Solutions
See step-by-step solutions with expert insights and AI powered tools for academic success
Step: 2

Step: 3

Ace Your Homework with AI
Get the answers you need in no time with our AI-driven, step-by-step assistance
Get Started


