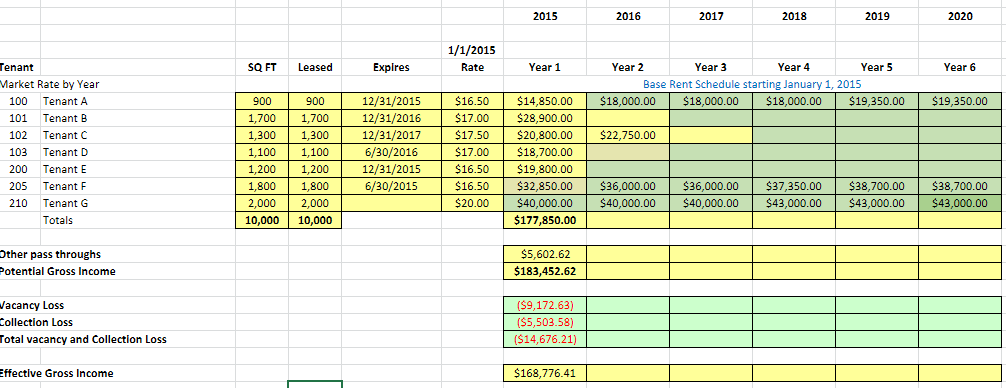
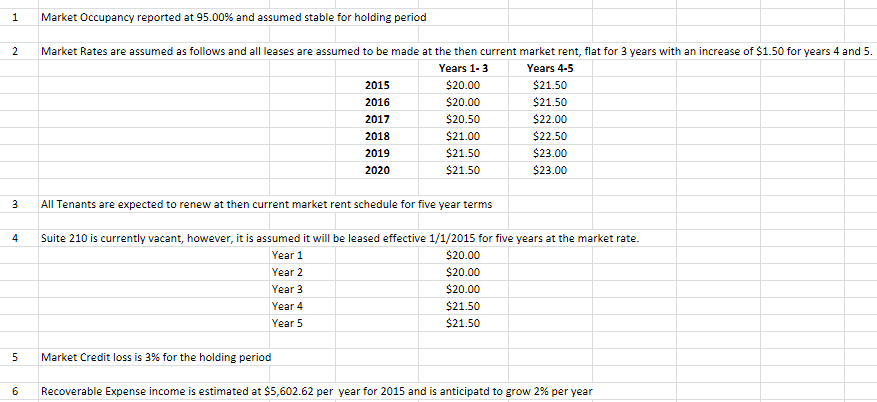
Fill in the missing information for 2016-2020


2015 2016 2017 2019 2020 2018 1/1/2015 Tenant SO FT Leased Year 6 Expires Rate Year 1 Year 2 Year 3 Year 4 Year 5 Market Rate by Year Base Rent Schedule starting January 1, 2015 12/31/2015 $16.50 $14,850,00 $18,000.00 $18.000,00 $18,000.00 $19,350,00 $19.350,00 10C Tenant A 900 900 1,700 12/31/2016 $17.00 $28.900,00 101 Tenant B 1,700 12/31/2017 $17.50 $20.800,00 $22,750.00 102 Tenant C 1.300 1,300 Tenant D 6/30/2016 $17.00 $18,700.00 102 1.100 1.100 12/31/2015 $16.50 $19,800.00 200 Tenant E 1,200 1,200 $36,000,00 $38,700.00 6/30/2015 $16.50 $32,850.00 $36,000.00 $37,350.00 $38,700.00 205 Tenant F 1,800 1,800 $20.00 $40,000.00 $40,000.00 $40.000.00 $43 000 00 $43,000.00 $43.000,00 210 Tenant G 2,000 2,000 $177,850.00 Totals 10,000 10,000 Other pass throughs Potential Gross Income $5,602.62 $183,452.62 acancy Loss Collection Loss ($9,172.63) ($5,503.58) Total vacancy and Collection Loss ($14,676.21) Effective Gross Income $168,776.41 Market Occupancy reported at 95.00 % and assumed stable for holding period 1 Market Rates are assumed as follows and all leases are assumed to be made at the then current market rent, flat for 3 years with an increase of $1.50 for years 4 and 5. 2 Years 1-3 Years 4-5 $20.00 $21.50 2015 $20.00 $21.50 2016 $20.50 $22.00 2017 $21.00 $22.50 2018 $21.50 $23.00 2019 $21.50 $23.00 2020 3 All Tenants are expected to renew at then current market rent schedule for five year terms Suite 210 is currently vacant, however, it is assumed it will be leased effective 1/1/2015 for five years at the market rate. 4. $20.00 Year 1 $20,00 Year 2 $20.00 Year 3 $21.50 Year 4 $21.50 Year 5 5 Market Credit loss is 3 % for the holding period Recoverable Expense income is estimated at $5,602.62 per year for 2015 and is anticipatd to grow 2 % per year 6 Rentroll Information Effective June 1, 2014 Current Monthy Current Current Monthy Current Monthy Current Monthy Annual Rent Base Rent Additional Rent Total Rent Suite Tenant SQ FT Leased Commence Expire Base Rate Base Rent Increases $14,850.00 $28 900 00 $1.237.50 $59.13 en 45 $1.296.63 $2 498 73 Tenant A 01/01/10 $16.50 -5 16 50 12/31/15 rs 1-3 315.00 100 1 700 Tenant C Tenant D Tenant E Tenant P Vacant 102 1 300 1,300 01/01/12 12/31/17 $17.50 $22,750.00 $1,895.83 $52.51 $1.948.34 Yrs 1-3 $16.00 Yrs 4-5 17.50 Yrs 1-3 $15.50 Yrs 4-5 17.00 Yrs 1-3 $15.00 Yrs 4-5 1650 Yrs 1-3 $15.00 Yrs 4-5 16.50 06/30/16 103 1.100 1,100 07/01/11 $17.00 $18,700.00 $1,558.33 $58.52 $1,616.86 200 1.200 1,200 01/01/10 12/31/15 $16.50 $19,800.00 $1,650.00 $78.84 $1,728.84 07/01/10 06/30/15 $118.27 205 1.800 1,800 $16.50 $29,700.00 $2,475.00 $2,593.27 $0.00 $0.00 $0.00 210 2.000 $0.00 $0.00 $11.682.73 10.000 $11,225.00 $457.73 Totals 8.000 $134.700,00 80.00 % 2015 2016 2017 2019 2020 2018 1/1/2015 Tenant SO FT Leased Year 6 Expires Rate Year 1 Year 2 Year 3 Year 4 Year 5 Market Rate by Year Base Rent Schedule starting January 1, 2015 12/31/2015 $16.50 $14,850,00 $18,000.00 $18.000,00 $18,000.00 $19,350,00 $19.350,00 10C Tenant A 900 900 1,700 12/31/2016 $17.00 $28.900,00 101 Tenant B 1,700 12/31/2017 $17.50 $20.800,00 $22,750.00 102 Tenant C 1.300 1,300 Tenant D 6/30/2016 $17.00 $18,700.00 102 1.100 1.100 12/31/2015 $16.50 $19,800.00 200 Tenant E 1,200 1,200 $36,000,00 $38,700.00 6/30/2015 $16.50 $32,850.00 $36,000.00 $37,350.00 $38,700.00 205 Tenant F 1,800 1,800 $20.00 $40,000.00 $40,000.00 $40.000.00 $43 000 00 $43,000.00 $43.000,00 210 Tenant G 2,000 2,000 $177,850.00 Totals 10,000 10,000 Other pass throughs Potential Gross Income $5,602.62 $183,452.62 acancy Loss Collection Loss ($9,172.63) ($5,503.58) Total vacancy and Collection Loss ($14,676.21) Effective Gross Income $168,776.41 Market Occupancy reported at 95.00 % and assumed stable for holding period 1 Market Rates are assumed as follows and all leases are assumed to be made at the then current market rent, flat for 3 years with an increase of $1.50 for years 4 and 5. 2 Years 1-3 Years 4-5 $20.00 $21.50 2015 $20.00 $21.50 2016 $20.50 $22.00 2017 $21.00 $22.50 2018 $21.50 $23.00 2019 $21.50 $23.00 2020 3 All Tenants are expected to renew at then current market rent schedule for five year terms Suite 210 is currently vacant, however, it is assumed it will be leased effective 1/1/2015 for five years at the market rate. 4. $20.00 Year 1 $20,00 Year 2 $20.00 Year 3 $21.50 Year 4 $21.50 Year 5 5 Market Credit loss is 3 % for the holding period Recoverable Expense income is estimated at $5,602.62 per year for 2015 and is anticipatd to grow 2 % per year 6 Rentroll Information Effective June 1, 2014 Current Monthy Current Current Monthy Current Monthy Current Monthy Annual Rent Base Rent Additional Rent Total Rent Suite Tenant SQ FT Leased Commence Expire Base Rate Base Rent Increases $14,850.00 $28 900 00 $1.237.50 $59.13 en 45 $1.296.63 $2 498 73 Tenant A 01/01/10 $16.50 -5 16 50 12/31/15 rs 1-3 315.00 100 1 700 Tenant C Tenant D Tenant E Tenant P Vacant 102 1 300 1,300 01/01/12 12/31/17 $17.50 $22,750.00 $1,895.83 $52.51 $1.948.34 Yrs 1-3 $16.00 Yrs 4-5 17.50 Yrs 1-3 $15.50 Yrs 4-5 17.00 Yrs 1-3 $15.00 Yrs 4-5 1650 Yrs 1-3 $15.00 Yrs 4-5 16.50 06/30/16 103 1.100 1,100 07/01/11 $17.00 $18,700.00 $1,558.33 $58.52 $1,616.86 200 1.200 1,200 01/01/10 12/31/15 $16.50 $19,800.00 $1,650.00 $78.84 $1,728.84 07/01/10 06/30/15 $118.27 205 1.800 1,800 $16.50 $29,700.00 $2,475.00 $2,593.27 $0.00 $0.00 $0.00 210 2.000 $0.00 $0.00 $11.682.73 10.000 $11,225.00 $457.73 Totals 8.000 $134.700,00 80.00 %


