

Question
Fill in the missing information into the table. (Always use cell references and formulas where appropriate to receive full credit. If you copy/paste from the
Fill in the missing information into the table. (Always use cell references and formulas where appropriate to receive full credit. If you copy/paste from the Instructions tab you will be marked wrong.
PLEASE HELP!! IF POSSIBLE DO IN EXCEL, IF NOT POSSIBLE, PLS SHOW HOW YOU GOT ANSWERS SO I CAN DO IT. THANKS
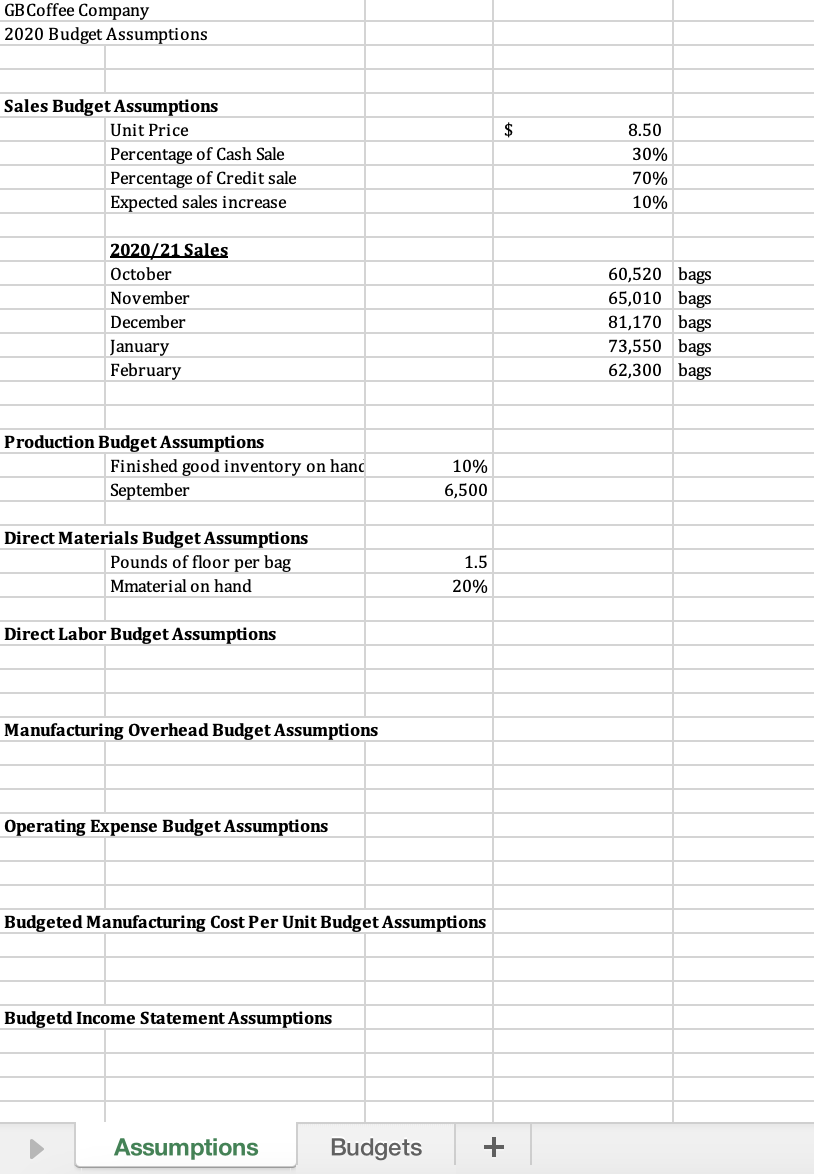
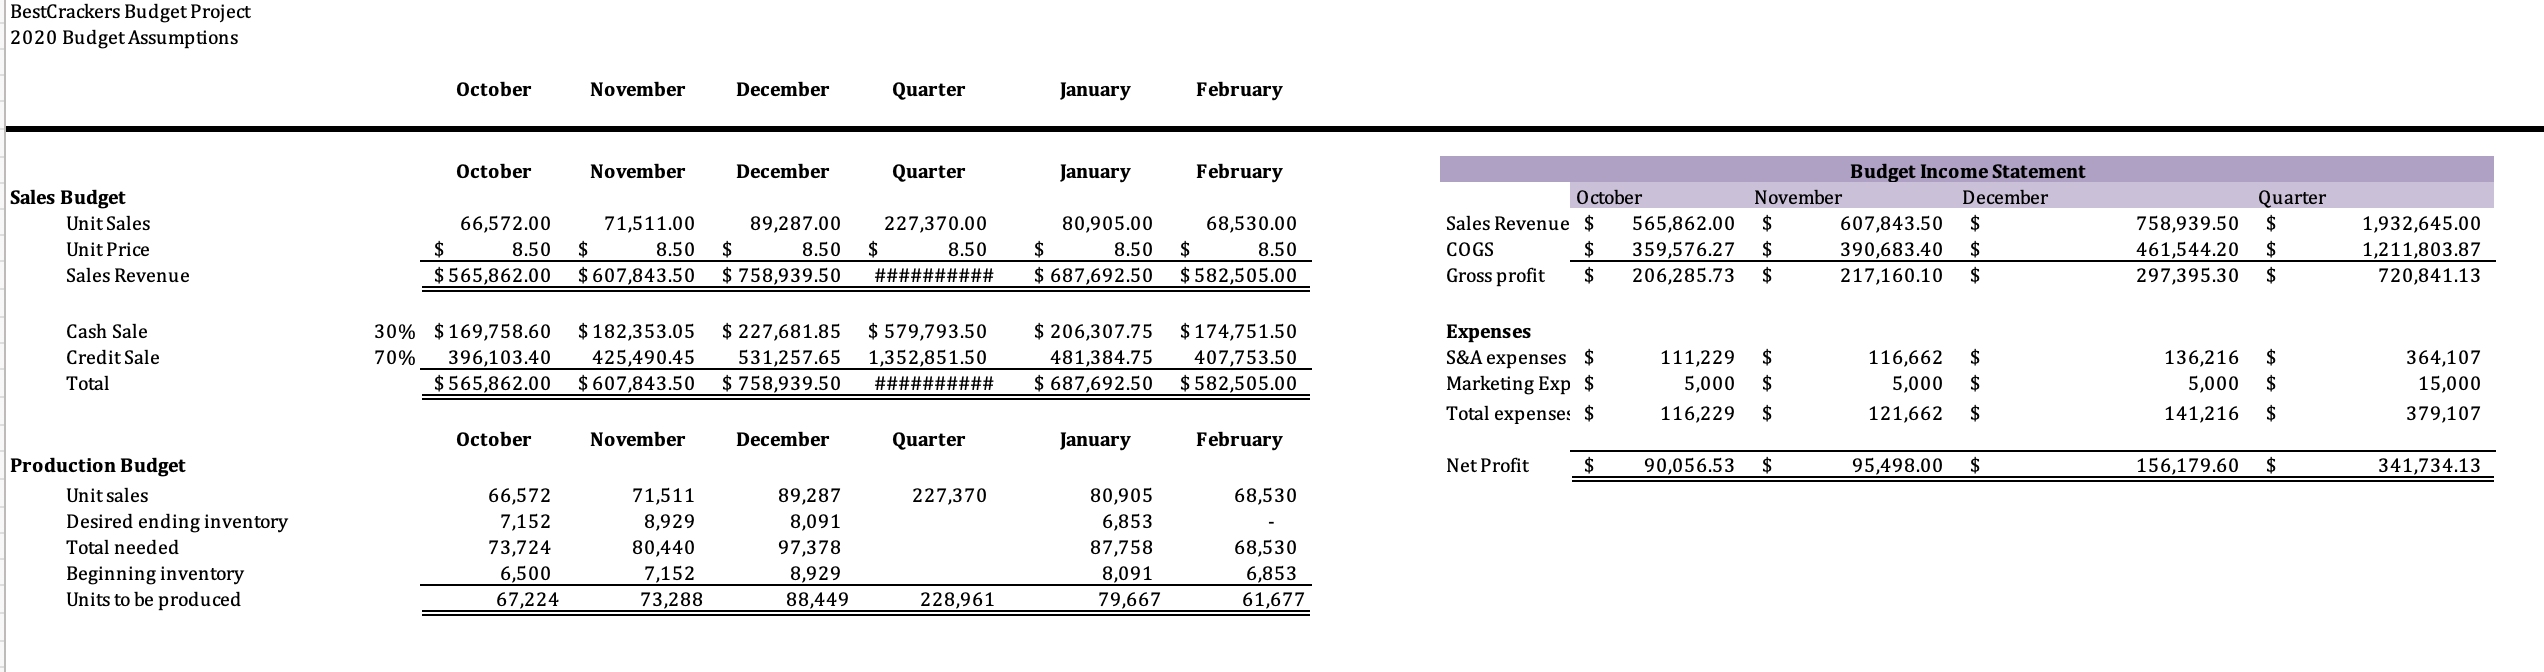
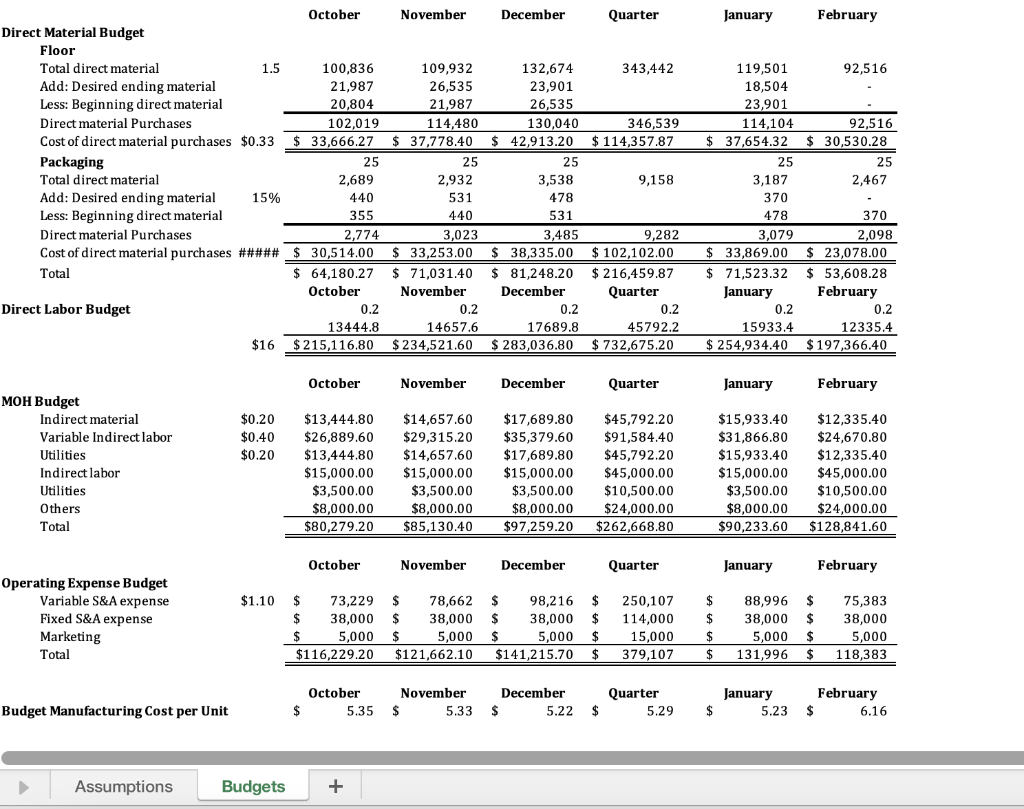
GB Coffee Company 2020 Budget Assumptions $ Sales Budget Assumptions Unit Price Percentage of Cash Sale Percentage of Credit sale Expected sales increase 8.50 30% 70% 10% 2020/21 Sales October November December January February 60,520 bags 65,010 bags 81,170 bags 73,550 bags 62,300 bags Production Budget Assumptions Finished good inventory on hand September 10% 6,500 Direct Materials Budget Assumptions Pounds of floor per bag Mmaterial on hand 1.5 20% Direct Labor Budget Assumptions Manufacturing Overhead Budget Assumptions Operating Expense Budget Assumptions Budgeted Manufacturing Cost Per Unit Budget Assumptions Budgetd Income Statement Assumptions Assumptions Budgets + BestCrackers Budget Project 2020 Budget Assumptions October November December Quarter January February October November December Quarter January February Sales Budget Unit Sales Unit Price Sales Revenue 66,572.00 $ 8.50 $ 565,862.00 71,511.00 $ 8.50 $ 607,843.50 89,287.00 $ 8.50 $ 758,939.50 227,370.00 $ ########## 80,905.00 $ 8.50 $ 687,692.50 October Sales Revenue $ 565,862.00 COGS $ 359,576.27 Gross profit $ 206,285.73 68,530.00 $ 8.50 $ 582,505.00 Budget Income Statement November December $ 607,843.50 $ $ 390,683.40 $ $ 217,160.10 $ 8.50 Quarter $ $ 758,939.50 461,544.20 297,395.30 1,932,645.00 1,211,803.87 720,841.13 $ Cash Sale Credit Sale 30% $ 169,758.60 70% 396,103.40 $ 565,862.00 $ 182,353.05 425,490.45 $ 607,843.50 $ 227,681.85 531,257.65 $ 758,939.50 $ 579,793.50 1,352,851.50 ########## $ 206,307.75 481,384.75 $ 687,692.50 $ 174,751.50 407,753.50 $ 582,505.00 Expenses S&A expenses $ Marketing Exp $ Total expense: $ 111,229 5,000 116,229 $ $ Total 116,662 5,000 121,662 $ $ 136,216 5,000 141,216 $ $ 364,107 15,000 379,107 $ $ $ October November December Quarter January February Net Profit $ 90,056.53 $ 95,498.00 $ 156,179.60 $ 341,734.13 227,370 68,530 Production Budget Unit sales Desired ending inventory Total needed Beginning inventory Units to be produced 66,572 7,152 73,724 6,500 67,224 71,511 8,929 80,440 7,152 73,288 89,287 8,091 97,378 8,929 88,449 80,905 6,853 87,758 8,091 79,667 68,530 6,853 61,677 228,961 October November December Quarter January February 343,442 92,516 346,539 $ 114,357.87 Direct Material Budget Floor Total direct material 1.5 Add: Desired ending material Less: Beginning direct material Direct material Purchases Cost of direct material purchases $0.33 Packaging Total direct material Add: Desired ending material 15% Less: Beginning direct material Direct material Purchases Cost of direct material purchases ##### Total 92,516 $ 30,530.28 25 2,467 9,158 100,836 21,987 20,804 102,019 33,666.27 25 2,689 440 355 2,774 30,514.00 $ 64,180.27 October 0.2 13444.8 $215,116.80 109,932 26,535 21,987 114,480 $ 37,778.40 25 2,932 531 440 3,023 $ 33,253.00 $ 71,031.40 November 0.2 14657.6 $ 234,521.60 132,674 23,901 26,535 130,040 $ 42,913.20 25 3,538 478 531 3,485 $ 38,335.00 $ 81,248.20 December 0.2 17689.8 $ 283,036.80 119,501 18,504 23,901 114,104 $ 37,654.32 25 3,187 370 478 3,079 $ 33,869.00 $ 71,523.32 January 0.2 15933.4 $ 254,934.40 9,282 $ 102,102.00 $ 216,459.87 Quarter 0.2 45792.2 $ 732,675.20 370 2,098 $ 23,078.00 $ 53,608.28 February 0.2 12335.4 $ 197,366.40 Direct Labor Budget $16 October November December Quarter January February $0.20 $0.40 $0.20 MOH Budget Indirect material Variable Indirect labor Utilities Indirect labor Utilities Others Total $13,444.80 $26,889.60 $13,444.80 $15,000.00 $3,500.00 $8,000.00 $80,279.20 $14,657.60 $29,315.20 $14,657.60 $15,000.00 $3,500.00 $8,000.00 $85,130.40 $17,689.80 $35,379.60 $17,689.80 $15,000.00 $3,500.00 $8,000.00 $97,259.20 $45,792.20 $91,584.40 $45,792.20 $45,000.00 $10,500.00 $24,000.00 $262,668.80 $15,933.40 $31,866.80 $15,933.40 $15,000.00 $3,500.00 $8,000.00 $90,233.60 $12,335.40 $24,670.80 $12,335.40 $45,000.00 $10,500.00 $24,000.00 $128,841.60 October November December Quarter January February $1.10 Operating Expense Budget Variable S&A expense Fixed S&A expense Marketing Total $ 73,229 $ 38,000 $ 5,000 $116,229.20 $ 78,662 $ 38,000 $ 5,000 $121,662.10 $ 98,216 $ 38,000 $ 5,000 $141,215.70 $ $ $ 250,107 114,000 15,000 379,107 $ $ $ $ 88,996 38,000 5,000 131,996 $ $ $ $ 75,383 38,000 5,000 118,383 $ October November 5.35 $ 5.33 December $ 5.22 Quarter 5.29 January 5.23 February $ 6.16 Budget Manufacturing Cost per Unit $ $ Assumptions Budgets + GB Coffee Company 2020 Budget Assumptions $ Sales Budget Assumptions Unit Price Percentage of Cash Sale Percentage of Credit sale Expected sales increase 8.50 30% 70% 10% 2020/21 Sales October November December January February 60,520 bags 65,010 bags 81,170 bags 73,550 bags 62,300 bags Production Budget Assumptions Finished good inventory on hand September 10% 6,500 Direct Materials Budget Assumptions Pounds of floor per bag Mmaterial on hand 1.5 20% Direct Labor Budget Assumptions Manufacturing Overhead Budget Assumptions Operating Expense Budget Assumptions Budgeted Manufacturing Cost Per Unit Budget Assumptions Budgetd Income Statement Assumptions Assumptions Budgets + BestCrackers Budget Project 2020 Budget Assumptions October November December Quarter January February October November December Quarter January February Sales Budget Unit Sales Unit Price Sales Revenue 66,572.00 $ 8.50 $ 565,862.00 71,511.00 $ 8.50 $ 607,843.50 89,287.00 $ 8.50 $ 758,939.50 227,370.00 $ ########## 80,905.00 $ 8.50 $ 687,692.50 October Sales Revenue $ 565,862.00 COGS $ 359,576.27 Gross profit $ 206,285.73 68,530.00 $ 8.50 $ 582,505.00 Budget Income Statement November December $ 607,843.50 $ $ 390,683.40 $ $ 217,160.10 $ 8.50 Quarter $ $ 758,939.50 461,544.20 297,395.30 1,932,645.00 1,211,803.87 720,841.13 $ Cash Sale Credit Sale 30% $ 169,758.60 70% 396,103.40 $ 565,862.00 $ 182,353.05 425,490.45 $ 607,843.50 $ 227,681.85 531,257.65 $ 758,939.50 $ 579,793.50 1,352,851.50 ########## $ 206,307.75 481,384.75 $ 687,692.50 $ 174,751.50 407,753.50 $ 582,505.00 Expenses S&A expenses $ Marketing Exp $ Total expense: $ 111,229 5,000 116,229 $ $ Total 116,662 5,000 121,662 $ $ 136,216 5,000 141,216 $ $ 364,107 15,000 379,107 $ $ $ October November December Quarter January February Net Profit $ 90,056.53 $ 95,498.00 $ 156,179.60 $ 341,734.13 227,370 68,530 Production Budget Unit sales Desired ending inventory Total needed Beginning inventory Units to be produced 66,572 7,152 73,724 6,500 67,224 71,511 8,929 80,440 7,152 73,288 89,287 8,091 97,378 8,929 88,449 80,905 6,853 87,758 8,091 79,667 68,530 6,853 61,677 228,961 October November December Quarter January February 343,442 92,516 346,539 $ 114,357.87 Direct Material Budget Floor Total direct material 1.5 Add: Desired ending material Less: Beginning direct material Direct material Purchases Cost of direct material purchases $0.33 Packaging Total direct material Add: Desired ending material 15% Less: Beginning direct material Direct material Purchases Cost of direct material purchases ##### Total 92,516 $ 30,530.28 25 2,467 9,158 100,836 21,987 20,804 102,019 33,666.27 25 2,689 440 355 2,774 30,514.00 $ 64,180.27 October 0.2 13444.8 $215,116.80 109,932 26,535 21,987 114,480 $ 37,778.40 25 2,932 531 440 3,023 $ 33,253.00 $ 71,031.40 November 0.2 14657.6 $ 234,521.60 132,674 23,901 26,535 130,040 $ 42,913.20 25 3,538 478 531 3,485 $ 38,335.00 $ 81,248.20 December 0.2 17689.8 $ 283,036.80 119,501 18,504 23,901 114,104 $ 37,654.32 25 3,187 370 478 3,079 $ 33,869.00 $ 71,523.32 January 0.2 15933.4 $ 254,934.40 9,282 $ 102,102.00 $ 216,459.87 Quarter 0.2 45792.2 $ 732,675.20 370 2,098 $ 23,078.00 $ 53,608.28 February 0.2 12335.4 $ 197,366.40 Direct Labor Budget $16 October November December Quarter January February $0.20 $0.40 $0.20 MOH Budget Indirect material Variable Indirect labor Utilities Indirect labor Utilities Others Total $13,444.80 $26,889.60 $13,444.80 $15,000.00 $3,500.00 $8,000.00 $80,279.20 $14,657.60 $29,315.20 $14,657.60 $15,000.00 $3,500.00 $8,000.00 $85,130.40 $17,689.80 $35,379.60 $17,689.80 $15,000.00 $3,500.00 $8,000.00 $97,259.20 $45,792.20 $91,584.40 $45,792.20 $45,000.00 $10,500.00 $24,000.00 $262,668.80 $15,933.40 $31,866.80 $15,933.40 $15,000.00 $3,500.00 $8,000.00 $90,233.60 $12,335.40 $24,670.80 $12,335.40 $45,000.00 $10,500.00 $24,000.00 $128,841.60 October November December Quarter January February $1.10 Operating Expense Budget Variable S&A expense Fixed S&A expense Marketing Total $ 73,229 $ 38,000 $ 5,000 $116,229.20 $ 78,662 $ 38,000 $ 5,000 $121,662.10 $ 98,216 $ 38,000 $ 5,000 $141,215.70 $ $ $ 250,107 114,000 15,000 379,107 $ $ $ $ 88,996 38,000 5,000 131,996 $ $ $ $ 75,383 38,000 5,000 118,383 $ October November 5.35 $ 5.33 December $ 5.22 Quarter 5.29 January 5.23 February $ 6.16 Budget Manufacturing Cost per Unit $ $ Assumptions Budgets +Step by Step Solution
There are 3 Steps involved in it
Step: 1

Get Instant Access to Expert-Tailored Solutions
See step-by-step solutions with expert insights and AI powered tools for academic success
Step: 2

Step: 3
Ace Your Homework with AI
Get the answers you need in no time with our AI-driven, step-by-step assistance
Get Started
Intermediate Accounting Volume 2
Authors: Hanlon, Hodder, Nelson, Roulstone, Dragoo
2nd Edition
1618533134, 9781618533357