Fill in the table with the information provided.
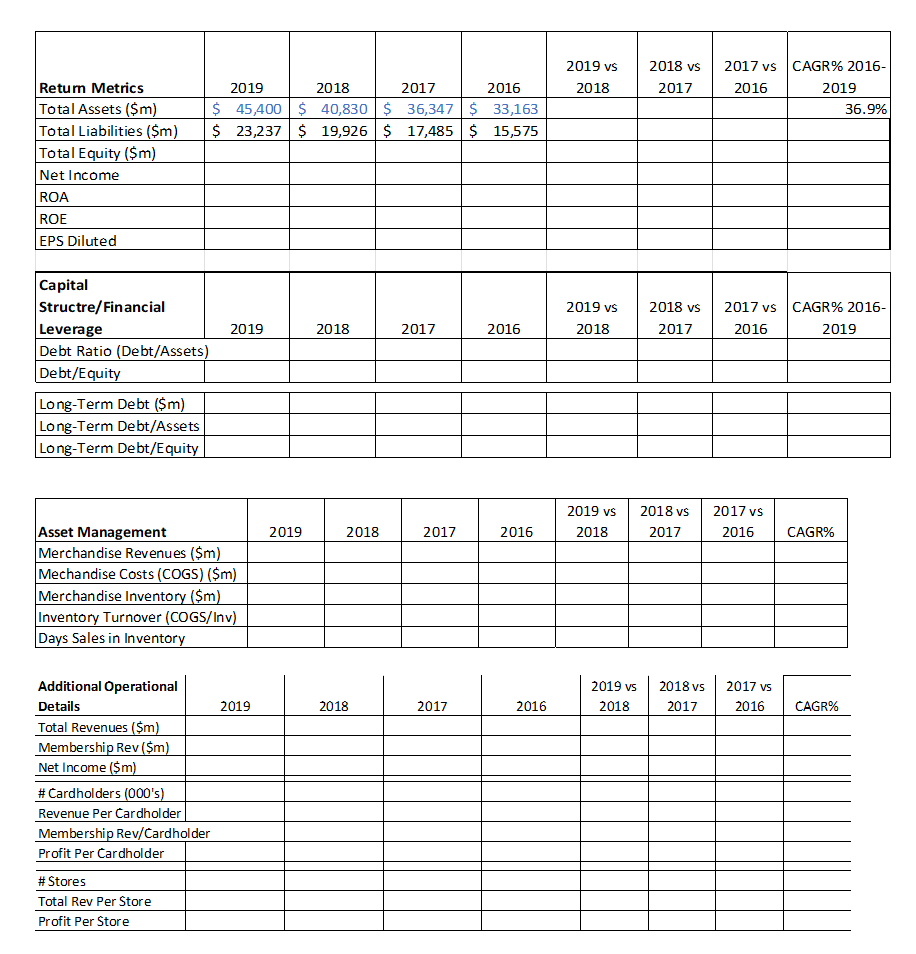
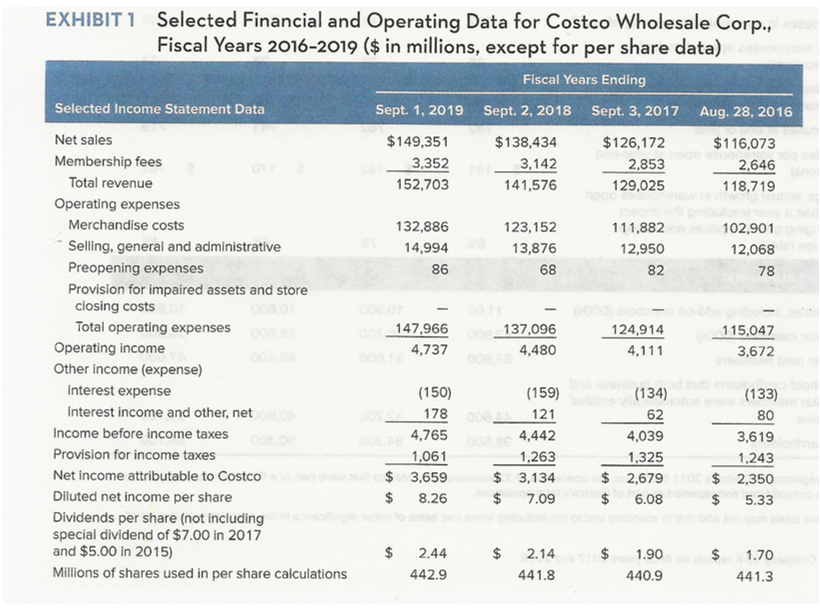
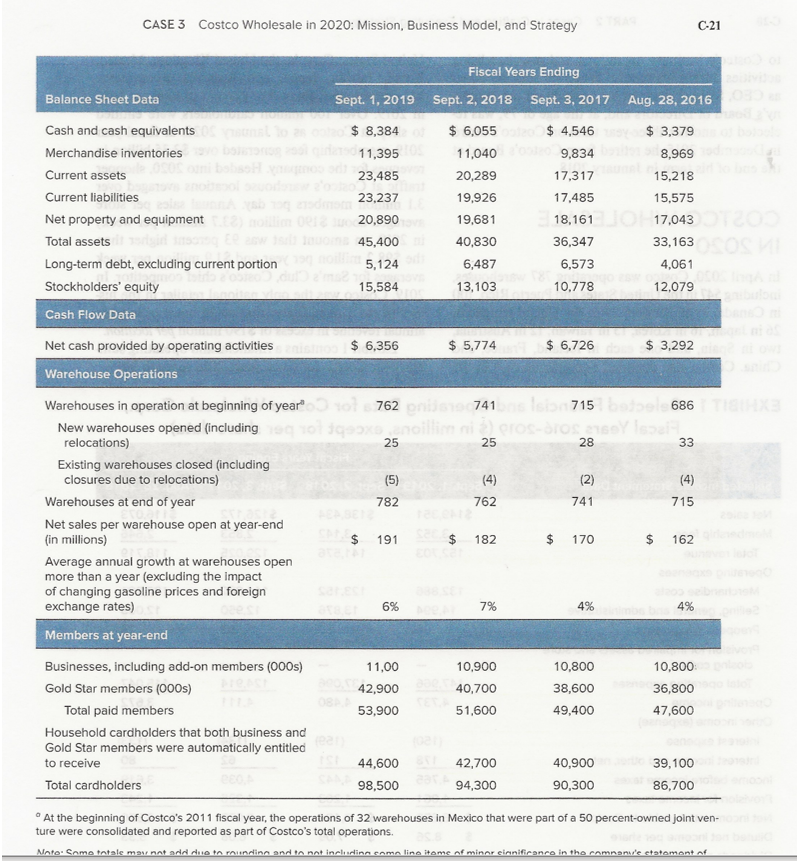
2019 vs 2018 Vs 2017 2018 2019 2018 2017 2016 $ 45,400 $ 40,830 $ 36,347 $ 33,163 $ 23,237 $ 19,926 $ 17,485 $ 15,575 2017 vs CAGR% 2016- 2016 2019 36.9% Retum Metrics Total Assets ($m) Total Liabilities ($m) Total Equity ($m) Net Income ROA ROE EPS Diluted 2019 vs 2018 2018 vs 2017 2017 vs 2016 CAGR% 2016- 2019 2019 2018 2017 2016 Capital Structre/Financial Leverage Debt Ratio (Debt/Assets) Debt/Equity Long-Term Debt ($m) Long-Term Debt/Assets Long-Term Debt/Equity 2019 vs 2018 vs 2017 2017 vs 2016 2019 2018 2017 2016 2018 CAGR% Asset Management Merchandise Revenues ($m) Mechandise Costs (COGS) ($m) Merchandise Inventory ($m) Inventory Turnover (COGS/Inv) Days Sales in Inventory 2019 vs 2018 2018 vs 2017 2017 vs 2016 2019 2018 2017 2016 CAGR% Additional Operational Details Total Revenues ($m) Membership Rev ($m) Net Income ($m) # Cardholders (000's) Revenue Per Cardholder Membership Rev/Cardholder Profit Per Cardholder #Stores Total Rev Per Store Profit Per Store EXHIBIT1 Selected Financial and Operating Data for Costco Wholesale Corp., Fiscal Years 2016-2019 ($ in millions, except for per share data) Fiscal Years Ending Selected Income Statement Data Sept. 1, 2019 Sept. 2, 2018 Sept. 3, 2017 Aug. 28, 2016 Net sales $149,351 $138,434 $126,172 $116,073 Membership fees 3,352 3,142 2,853 2,646 Total revenue 152,703 141,576 129,025 118,719 Operating expenses Merchandise costs 132,886 123,152 111,882 102,901 Selling, general and administrative 14,994 13,876 12,950 12,068 Preopening expenses 86 68 82 78 Provision for impaired assets and store closing costs Total operating expenses 147,966 137,096 124,914 115,047 Operating income 4,737 4,480 4,111 3,672 Other income (expense) Interest expense (150) (159) (134) (133) Interest income and other, net 121 80 Income before income taxes 4,765 4,442 4,039 3,619 Provision for income taxes 1,061 1,263 1,325 1,243 Net income attributable to Costco $ 3,659 $ 3,134 $ 2,679 $ 2,350 Diluted net income per share $ 8.26 $ 7.09 $ 6.08 $ 5.33 Dividends per share (not including special dividend of $7.00 in 2017 and $5.00 in 2015) $ 2.44 $ 2.14 $ 1.90 $ 1.70 Millions of shares used in per share calculations 442.9 441.8 440.9 441.3 178 62 CASE 3 Costco Wholesale in 2020: Mission, Business Model, and Strategy C-21 Fiscal Years Ending Balance Sheet Data Sept. 1, 2019 Sept. 2, 2018 Sept. 3, 2017 Aug. 28, 2016 Cash and cash equivalents $ 8,384 $ 6,055 $ 4,546 $ 3,379 Merchandise inventories 11,395 11,040 9,834 8,969 Current assets 23,485 20,289 17,317 15,218 Current liabilities 23.237 19,926 17,485 15,575 Net property and equipment 20,890 19,681 18,161 17,043 17,043 Total assets 45,400 40,830 36,347 33,163 Long-term debt, excluding current portion 5,124 6,487 6,573 4,061 Stockholders' equity 15,584 13,103 10.778 12,079 Cash Flow Data Net cash provided by operating activities $ 6,356 $ 5,774 $ 6,726 $ 3,292 Warehouse Operations Warehouses in operation at beginning of year 762741 715 686 New warehouses opened (including 102nollirIONY relocations) 25 25 28 33 Existing warehouses closed (including closures due to relocations) (4) (2) (4) Warehouses at end of year 782 762 741 715 Net sales per warehouse open at year-end (in millions) 191 $ 182 $ 170 $ 162 Average annual growth at warehouses open more than a year (excluding the impact of changing gasoline prices and foreign exchange rates) 6% 4% 4% Members at year-end Businesses, including add-on members (000s) 11,00 10.900 10,800 10,800 Gold Star members (000s) 42,900 40,700 38,600 36,800 Total paid members 53,900 51,600 49,400 47,600 Household cardholders that both business and Gold Star members were automatically entitled to receive 44,600 42,700 40,900 39,100 Total cardholders 98,500 94,300 90,300 86,700 E (5) $ $ $ 7% At the beginning of Costco's 2011 fiscal year, the operations of 32 warehouses in Mexico that were part of a 50 percent-owned joint ven- ture were consolidated and reported as part of Costco's total operations. NntoSomo tatale may not add nuo to roundinn and to not includinneomolina itome of minor einnificance in the company's ststomont of 2019 vs 2018 Vs 2017 2018 2019 2018 2017 2016 $ 45,400 $ 40,830 $ 36,347 $ 33,163 $ 23,237 $ 19,926 $ 17,485 $ 15,575 2017 vs CAGR% 2016- 2016 2019 36.9% Retum Metrics Total Assets ($m) Total Liabilities ($m) Total Equity ($m) Net Income ROA ROE EPS Diluted 2019 vs 2018 2018 vs 2017 2017 vs 2016 CAGR% 2016- 2019 2019 2018 2017 2016 Capital Structre/Financial Leverage Debt Ratio (Debt/Assets) Debt/Equity Long-Term Debt ($m) Long-Term Debt/Assets Long-Term Debt/Equity 2019 vs 2018 vs 2017 2017 vs 2016 2019 2018 2017 2016 2018 CAGR% Asset Management Merchandise Revenues ($m) Mechandise Costs (COGS) ($m) Merchandise Inventory ($m) Inventory Turnover (COGS/Inv) Days Sales in Inventory 2019 vs 2018 2018 vs 2017 2017 vs 2016 2019 2018 2017 2016 CAGR% Additional Operational Details Total Revenues ($m) Membership Rev ($m) Net Income ($m) # Cardholders (000's) Revenue Per Cardholder Membership Rev/Cardholder Profit Per Cardholder #Stores Total Rev Per Store Profit Per Store EXHIBIT1 Selected Financial and Operating Data for Costco Wholesale Corp., Fiscal Years 2016-2019 ($ in millions, except for per share data) Fiscal Years Ending Selected Income Statement Data Sept. 1, 2019 Sept. 2, 2018 Sept. 3, 2017 Aug. 28, 2016 Net sales $149,351 $138,434 $126,172 $116,073 Membership fees 3,352 3,142 2,853 2,646 Total revenue 152,703 141,576 129,025 118,719 Operating expenses Merchandise costs 132,886 123,152 111,882 102,901 Selling, general and administrative 14,994 13,876 12,950 12,068 Preopening expenses 86 68 82 78 Provision for impaired assets and store closing costs Total operating expenses 147,966 137,096 124,914 115,047 Operating income 4,737 4,480 4,111 3,672 Other income (expense) Interest expense (150) (159) (134) (133) Interest income and other, net 121 80 Income before income taxes 4,765 4,442 4,039 3,619 Provision for income taxes 1,061 1,263 1,325 1,243 Net income attributable to Costco $ 3,659 $ 3,134 $ 2,679 $ 2,350 Diluted net income per share $ 8.26 $ 7.09 $ 6.08 $ 5.33 Dividends per share (not including special dividend of $7.00 in 2017 and $5.00 in 2015) $ 2.44 $ 2.14 $ 1.90 $ 1.70 Millions of shares used in per share calculations 442.9 441.8 440.9 441.3 178 62 CASE 3 Costco Wholesale in 2020: Mission, Business Model, and Strategy C-21 Fiscal Years Ending Balance Sheet Data Sept. 1, 2019 Sept. 2, 2018 Sept. 3, 2017 Aug. 28, 2016 Cash and cash equivalents $ 8,384 $ 6,055 $ 4,546 $ 3,379 Merchandise inventories 11,395 11,040 9,834 8,969 Current assets 23,485 20,289 17,317 15,218 Current liabilities 23.237 19,926 17,485 15,575 Net property and equipment 20,890 19,681 18,161 17,043 17,043 Total assets 45,400 40,830 36,347 33,163 Long-term debt, excluding current portion 5,124 6,487 6,573 4,061 Stockholders' equity 15,584 13,103 10.778 12,079 Cash Flow Data Net cash provided by operating activities $ 6,356 $ 5,774 $ 6,726 $ 3,292 Warehouse Operations Warehouses in operation at beginning of year 762741 715 686 New warehouses opened (including 102nollirIONY relocations) 25 25 28 33 Existing warehouses closed (including closures due to relocations) (4) (2) (4) Warehouses at end of year 782 762 741 715 Net sales per warehouse open at year-end (in millions) 191 $ 182 $ 170 $ 162 Average annual growth at warehouses open more than a year (excluding the impact of changing gasoline prices and foreign exchange rates) 6% 4% 4% Members at year-end Businesses, including add-on members (000s) 11,00 10.900 10,800 10,800 Gold Star members (000s) 42,900 40,700 38,600 36,800 Total paid members 53,900 51,600 49,400 47,600 Household cardholders that both business and Gold Star members were automatically entitled to receive 44,600 42,700 40,900 39,100 Total cardholders 98,500 94,300 90,300 86,700 E (5) $ $ $ 7% At the beginning of Costco's 2011 fiscal year, the operations of 32 warehouses in Mexico that were part of a 50 percent-owned joint ven- ture were consolidated and reported as part of Costco's total operations. NntoSomo tatale may not add nuo to roundinn and to not includinneomolina itome of minor einnificance in the company's ststomont of