Answered step by step
Verified Expert Solution
Question
1 Approved Answer
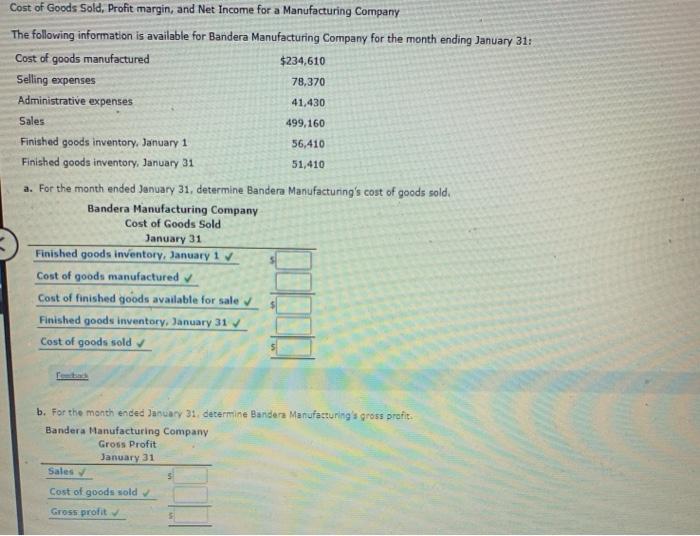
fill the rest of the chart out in the photos Cost of Goods Sold, Profit margin, and Net Income for a Manufacturing Company The following


fill the rest of the chart out in the photos
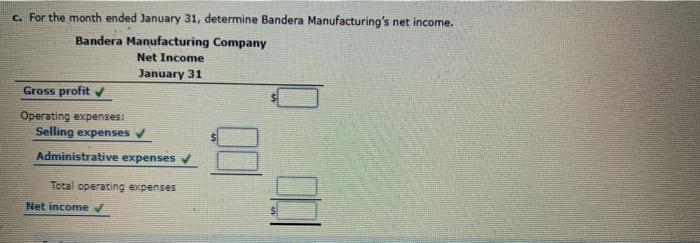
Cost of Goods Sold, Profit margin, and Net Income for a Manufacturing Company The following information is available for Bandera Manufacturing Company for the month ending January 31: Cost of goods manufactured $234,610 Selling expenses 78,370 Administrative expenses 41,430 Sales 499,160 Finished goods inventory, January 1 56,410 Finished goods inventory, January 31 51,410 a. For the month ended January 31, determine Bandera Manufacturing's cost of goods sold, Bandera Manufacturing Company Cost of Goods Sold January 31 Finished goods inventory, January 1 Cost of goods manufactured Cost of finished goods available for sale Finished goods inventory, January 31 Cost of goods sold b. For the month ended January 31. determine Bandera Manufacturing's gross profit. Bandera Manufacturing Company Gross Profit January 31 Sales Cost of goods sold Gross profit c. For the month ended January 31, determine Bandera Manufacturing's net income. Bandera Manufacturing Company Net Income January 31 Gross profit Operating expenses: Selling expenses Administrative expenses Total operating expenses Net income Step by Step Solution
There are 3 Steps involved in it
Step: 1

Get Instant Access to Expert-Tailored Solutions
See step-by-step solutions with expert insights and AI powered tools for academic success
Step: 2

Step: 3

Ace Your Homework with AI
Get the answers you need in no time with our AI-driven, step-by-step assistance
Get Started


