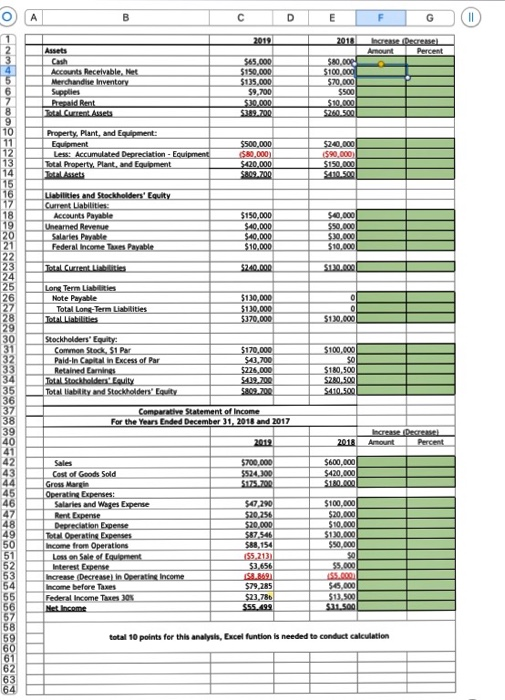
Filling the blank with Excel function
A B D E G II 1 2 2012 2011 Assets Amount Percent 15 6 17 8 19 10 Accounts Receivable, Net Merchandise Inventory Supplies Prepaid Rent Joul Current Assets 565.000 $150,000 $135,000 59,700 $30.000 $289.700 $80.000 $100,000 $70,000 $500 $10.000 $260.500 Property. Plant, and Equipment: Equipment Less: Accumulated Depreciation - Equipment Total Property, Plant, and Equipment 12 13 14 115 16 $500,000 $80.000) $420,000 $899.700 $240,000 590.000 $150.000 $410.500 17 18 19 20 Liabilities and Stockholders' Equity Current Liabilities: Accounts Payable Unearned Revenue Salaries Poyable Federal Income Taxes Payable $150,000 $40,000 $40.000 $10,000 $40,000 $50,000 $30,000 $10,000 21 22 23 24 Total Current Listes $240.000 $130.000 25 0 Long Term Liabilities Note Payable Total Long-Term Liabilities Total Liabilities 5130,000 5130,000 $370,000 5130,000 26 27 28 29 30 31 32 33 34 35 36 37 38 39 40 41 42 Stockholders' Equity: Common Stock, S1 Par Paid-In Capital in Excess of Par Retained Earnings Total Stockholders' Equity Total liability and Stockholders' Equity $170,000 $10,700 $225,000 5409.700 5809.700 $100,000 $0 $180,500 $280.500 $410.500 Comparative Statement of Income For the Years Ended December 31, 2018 and 2017 2019 2014 Amount Percent 43 $700.000 5524.300 5175,700 $600,000 $420,000 $180.000 Sales Cost of Goods Sold Gross Margin Operating Expenses: Salaries and Wages Expense Rent Expense Depreciation Expense Total Operating Expenses Income from Operations Loss on Sale of Equipment Interest Expense Increase Decrease in Operating Income Income before Taxes Federal Income Taxes OK Net Income 50,290 $20.256 $20.000 $87.546 $88,154 155,213) $3.656 44 45 46 47 48 49 50 51 52 53 54 55 56 57 58 59 60 61 62 63 64 $100,000 $20.000 $10.000 $120.000 $50,000 $o 55.000 $79,285 $23.786 $55.199 545,000 513.500 $31.500 total 10 points for this analysis, Excel funtion is needed to conduct calculation