

Answered step by step
Verified Expert Solution
Question
1 Approved Answer
FIN300 can someone help me! Homework: Lab 11 Save Score: 0 of 1 pt 6 of 15 (12 complete) HW Score: 68%, 10.2 of 15
FIN300 can someone help me! 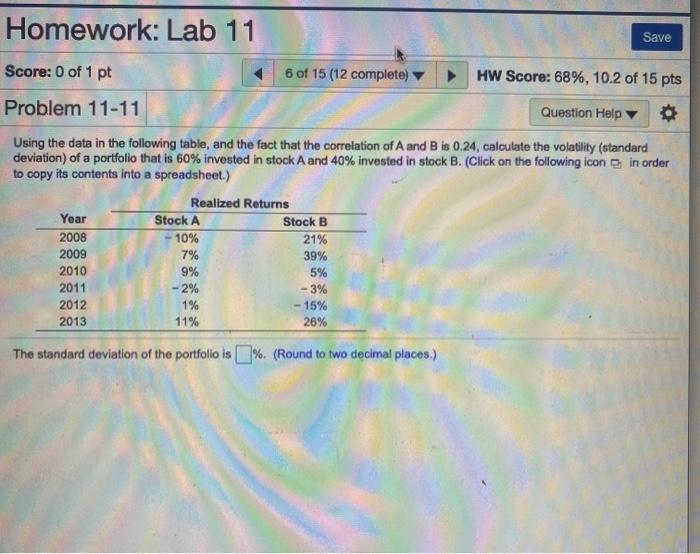
Homework: Lab 11 Save Score: 0 of 1 pt 6 of 15 (12 complete) HW Score: 68%, 10.2 of 15 pts Problem 11-11 Question Help Using the data in the following table, and the fact that the correlation of A and B is 0.24, calculate the volatility (standard deviation) of a portfolio that is 60% invested in stock A and 40% invested in stock B. (Click on the following icon in order to copy its contents into a spreadsheet.) Realized Returns Year Stock A Stock B 2008 10% 21% 2009 7% 39% 2010 9% 5% 2011 - 2% - 3% 2012 1% 15% 2013 11% 26% The standard deviation of the portfolio is %, (Round to two decimal places.) Step by Step Solution
There are 3 Steps involved in it
Step: 1

Get Instant Access to Expert-Tailored Solutions
See step-by-step solutions with expert insights and AI powered tools for academic success
Step: 2

Step: 3
Ace Your Homework with AI
Get the answers you need in no time with our AI-driven, step-by-step assistance
Get Started
The Secret Of Real Estate Best Strategies On How To Earn With Real Estate Investments
Authors: Chris Brandon
1st Edition
979-8838170026