Answered step by step
Verified Expert Solution
Question
1 Approved Answer
FINAL EXAM a- Examine the relationship between EDUCATION and INCOME. Look at all the tables generated by a statistical analysis that you need to discuss
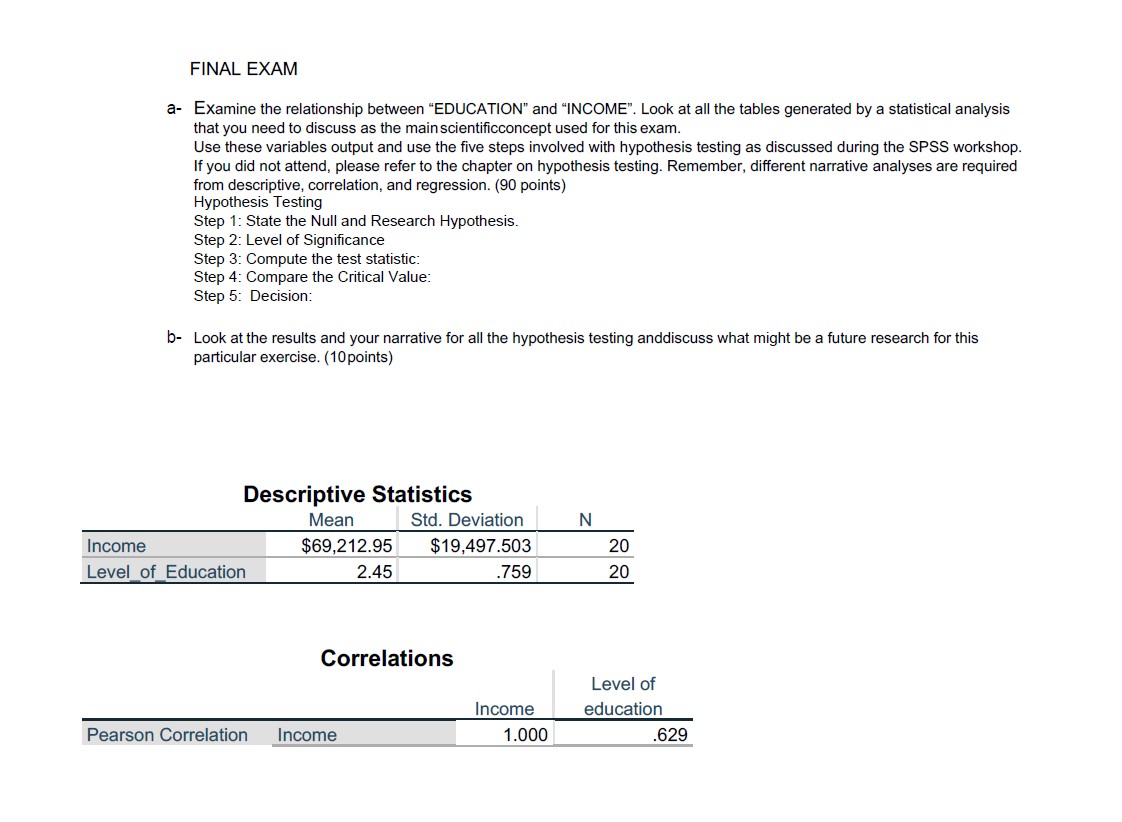
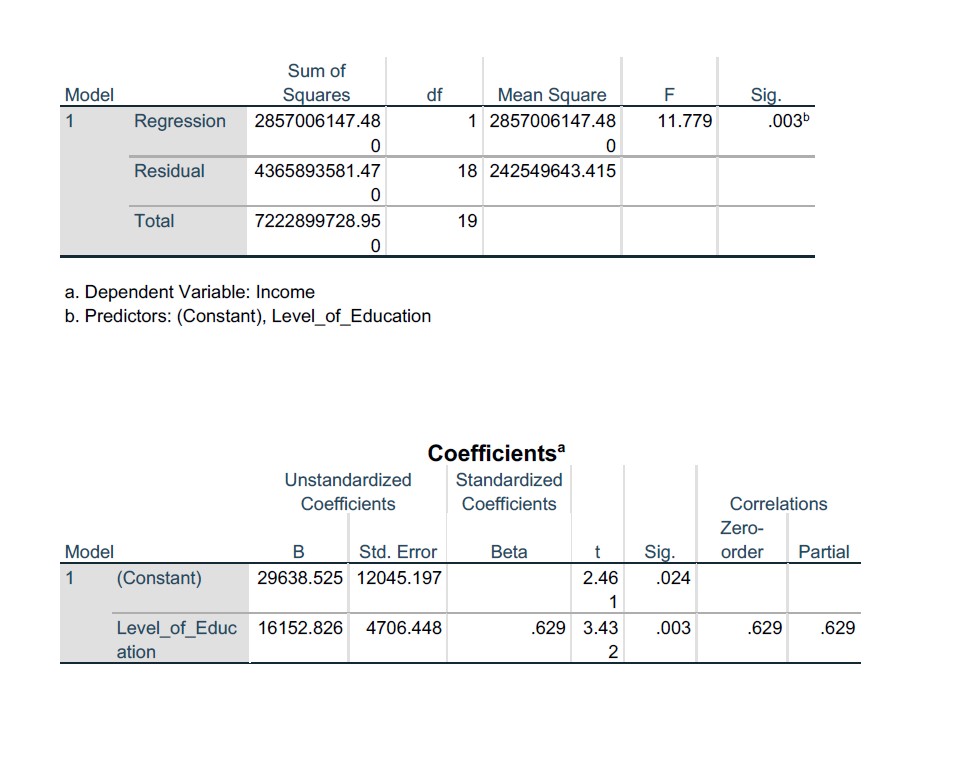
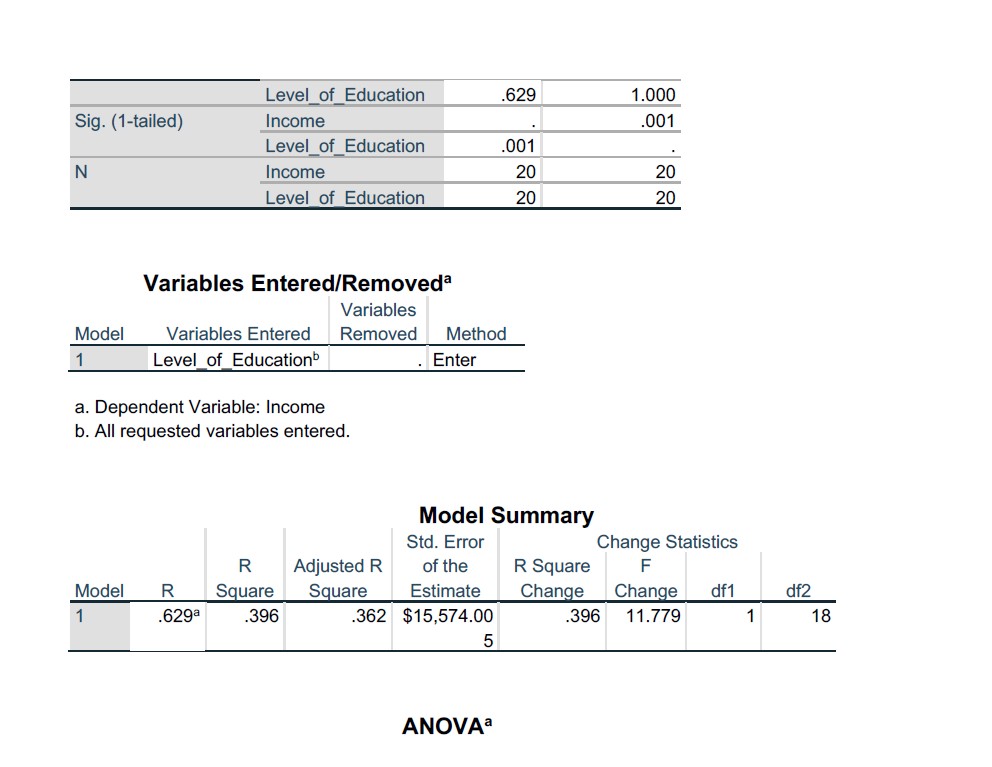
FINAL EXAM a- Examine the relationship between \"EDUCATION" and \"INCOME\". Look at all the tables generated by a statistical analysis that you need to discuss as the mainscientificconcept used for this exam. Use these variables output and use the five steps involved with hypothesis testing as discussed during the SPSS workshop. If you did not attend, please refer to the chapter on hypothesis testing. Remember, different narrative analyses are required from descriptive, correlation, and regression. (90 points) Hypothesis Testing Step 1: State the Null and Research Hypothesis. Step 2: Level of Significance Step 3: Compute the test statistic: Step 4: Compare the Critical Value: Step 5: Decision: b- Look at the results and your narrative for all the hypothesis testing anddiscuss what might be a future research for this particular exercise. (10points) Descriptive Statistics Mean Std. Deviation N Income $69,212.95 $19,497.503 20 Level of Education 2.45 .759 20 Correlations Level of Income education Pearson Correlation Income 1.000 .629 Level of Education .629 1.000 Sig. (1-tailed) Income : .001 Level of Education .001 : N Income 20 20 Level of Education 20 20 Variables Entered/Removed? Variables Model Variables Entered Removed Method 1 Level of Education . Enter a. Dependent Variable: Income b. All requested variables entered. Model Summary Std. Error Change Statistics R Adjusted R of the R Square F Model R Square Square Estimate Change Change _ df1 df2 1 .629 .396 .362 $15,574.00 396 11.779 1 18 5 ANOVA? Sum of Model Squares df Mean Square F Sig. Regression 2857006147.48 1 2857006147.48 11.779 003b 0 0 Residual 4365893581.47 18 242549643.415 0 Total 7222899728.95 19 0 a. Dependent Variable: Income b. Predictors: (Constant), Level_of_Education Coefficients Unstandardized Standardized Coefficients Coefficients Correlations Zero- Model B Std. Error Beta t Sig. order Partial 1 (Constant) 29638.525 12045.197 2.46 024 Level of Educ 16152.826 4706.448 629 3.43 003 629 .629 ation 2
Step by Step Solution
There are 3 Steps involved in it
Step: 1
Get Instant Access to Expert-Tailored Solutions
See step-by-step solutions with expert insights and AI powered tools for academic success
Step: 2
Step: 3
Ace Your Homework with AI
Get the answers you need in no time with our AI-driven, step-by-step assistance
Get Started