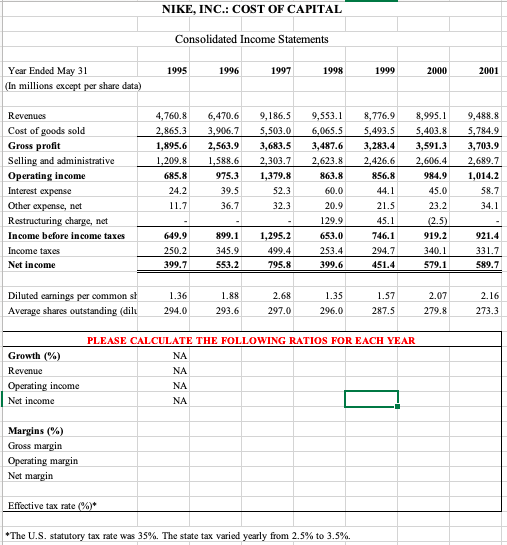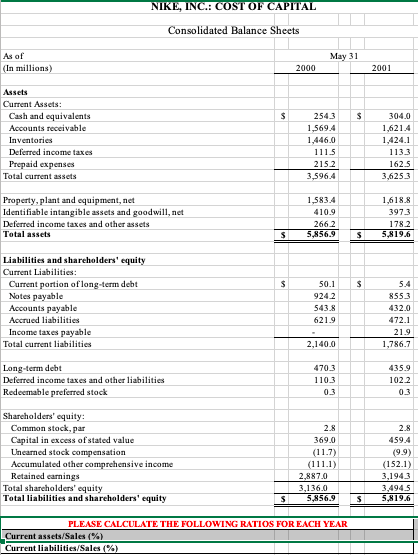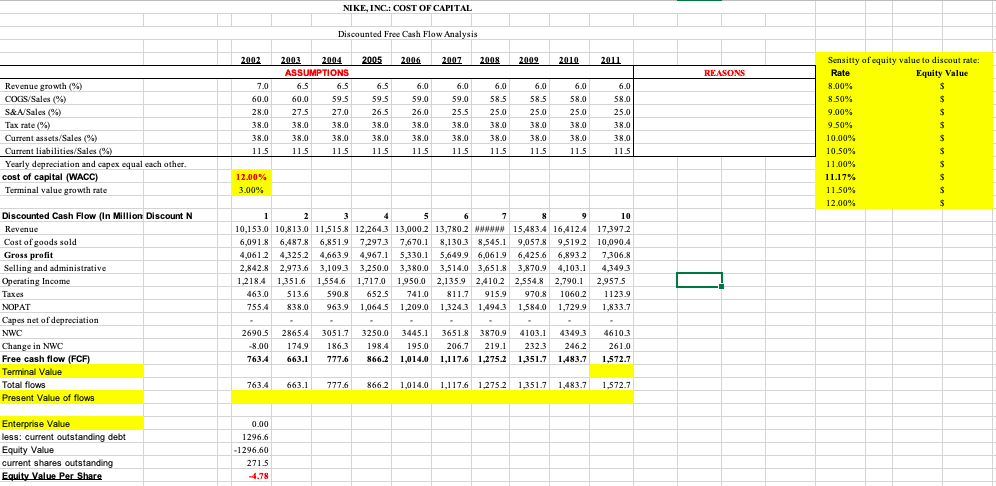


FINAL PROJECT INSTRUCTION 1. For the Income Statement, please calculate all the ratios in the black box below Income Statement. 2. For the Balance Sheet, please calculate all the ratios in the black box below the Balance Sheet. 3. For the DCF (Discounted Cash Flow or Free Cash Flow) Analysis, please make your own assumptions based on all the ratios you calculated for Question 1 and 2 and input your assumed numbers in the ASSUMPTION box. Also, please explain the reason why you make such assumptions in the REASON box . 4. Complete the DCF analysis using your given WACC and terminal growth rate and find the fair stock price at the bottom of the template. NIKE, INC.: COST OF CAPITAL Consolidated Income Statements 1995 1996 1997 1998 1999 2000 2001 Year Ended May 31 (In millions except per share data) Revenues Cost of goods sold Gross profit Selling and administrative Operating income Interest expense Other expense, net Restructuring charge, net Income before income taxes Income taxes Net income 4,760.8 2,865.3 1,895.6 1,209.8 685.8 24.2 11.7 6,470.6 3,906.7 2,563.9 1,588.6 975.3 39.5 36.7 9,186.5 5,503.0 3,683.5 2,303.7 1,379.8 52.3 32.3 9,553.1 6,065.5 3,487.6 2,623.8 863.8 60.0 20.9 129.9 653.0 253.4 399.6 8,776.9 5,493.5 3,283.4 2,426.6 856.8 44.1 21.5 45.1 746.1 294.7 451.4 8.995.1 5,403.8 3,591.3 2,606.4 984.9 45.0 23.2 9,488.8 5,784.9 3,703.9 2,689.7 1,014.2 58.7 34.1 (2.5) 649.9 250.2 399.7 899.1 345.9 553.2 1,295.2 499.4 795.8 919.2 340.1 579.1 921.4 331.7 589.7 Diluted carnings per common s! Average shares outstanding (dilu 1.36 294.0 1.88 293.6 2.68 297.0 1.35 296,0 1.57 287.5 2.07 279.8 2.16 273.3 Growth (%) Revenue Operating income Net income PLEASE CALCULATE THE FOLLOWING RATIOS FOR EACH YEAR NA NA NA NA Margins (%) Gross margin Operating margin Net margin Effective tax rate (%)* * The U.S. statutory tax rate was 35%. The state tax varied yearly from 2.5% to 3.5%. NIKE, INC.: COST OF CAPITAL Consolidated Balance Sheets May 31 As of (In millions) 2000 2001 $ $ Assets Current Assets: Cash and equivalents Accounts receivable Inventories Deferred income taxes Prepaid expenses Total current assets Property, plant and equipment, net Identifiable intangible assets and goodwill, net Deferred income taxes and other assets Total assets 2543 1,569.4 1,446.0 1115 2152 3,596.4 304.0 1,621.4 1,424.1 1133 1625 3,6253 1,583.4 410.9 2662 5,856.9 1,618.8 3973 1782 5,819.6 $ $ $ $ Liabilities and shareholders' equity Current Liabilities: Current portion of long-term debt Notes payable Accounts payable Accrued liabilities Income taxes payable Total current liabilities 50.1 9242 543.8 621.9 5.4 8553 432.0 472.1 21.9 1,786.7 2,140.0 Long-term debt Deferred income taxes and other liabilities Redeemable preferred stock 4703 110.3 0.3 435.9 1022 03 Shareholders' equity: Common stock, par Capital in excess of stated value Linearned stock compensation Accumulated other comprehensive income Retained earnings Total shareholders' equity Total liabilities and shareholders' equity 2.8 369.0 (11.7) (111.1) 2,887.0 3,136.0 5.356.9 2.8 459.4 (9.9) (152.1) 3,1943 3,4945 5,819.6 $ $ PLEASE CALCULATE THE FOLLOWING RATIOS FOR EACH YEAR Current assets/Sales (%) Current liabilities/Sales (%) NIKE, INC.: COST OF CAPITAL Discounted Free Cash Flow Analysis 2002 2005 2006 2007 2008 2009 2010 2011 REASONS 6.0 59.0 Revenue growth (%) COGS/Sales (%) S&A/Sales (%) Tax rate(%) Current assets/Sales (%) Current liabilities/Sales (%) Yearly depreciation and capex equal each other. cost of capital (WACC) Terminal value growth rate 7.0 60.0 28.0 38.0 38.0 2003 2004 ASSUMPTIONS 6.5 6.5 60.0 59.5 27.5 38.0 38.0 38.0 38.0 115 115 27.0 6.5 59.5 26.5 38.0 38.0 115 26.0 38.0 38.0 115 6.0 59.0 25.5 38.0 38.0 115 6.0 58.5 25.0 38.0 38.0 115 6.0 58.5 25.0 38.0 38.0 115 6.0 58.0 25.0 38.0 38.0 115 6.0 58.0 25.0 38.0 38.0 11.5 Sensity of equity value to discout rate: Rate Equity Value 8.00% $ 8.50% $ 9.00% $ 9.50% $ 10.00% $ 10.50% $ 11.00% $ 11.17% $ 11.50% $ 12.00% $ 115 12.00% % 3.00% Discounted Cash Flow (In Million Discount N Revenue Cost of goods sold Gross profit Selling and administrative Operating Income Taxes NOPAT Capes net of depreciation NWC Change in NWC Free cash flow (FCF) Terminal Value Total flows Present Value of flows 1 2 3 4 5 6 6 7 8 9 10 10,153.0 10,813.0 11.515.8 12,2643 13,000 2 13,780 2 wwwwww 15,483.4 16,4124 17,3972 6,091.8 6,487.8 6,851.9 7,2973 7,670.1 8,1303 8,545.1 9,057 8 9,5192 10,090,4 4,0612 4,325.2 4,663.9 4,967.1 5,330.1 5,649.9 6,061.9 6,425.6 6,8932 7,306.8 2,842.8 2,973.6 3,1093 3,250.0 3,380.0 3,514.0 3,651.8 3,870.9 4,103.1 4,349.3 1.218.4 1,351.6 1,554.6 1,717,0 1,950.0 2,135.9 2,4102 2,554.8 2,790.1 2,9575 4630 513.6 590.8 652.5 741.0 811.7 915.9 970.8 10602 1123.9 755.4 838.0 963.9 1.064.5 1,209.0 1,3243 1,4943 1,584,0 1,729.9 1,833.7 [] 2690.5 -8.00 763.4 2865.4 174.9 663.1 3051.7 1863 777.6 3250.0 3445.1 3651.8 3870.9 4103.1 43493 198.4 195.0 206.7 219.1 2323 246.2 866.2 1,014.0 1,117,6 1,275.2 1,351.7 1,483.7 46103 261.0 1,572.7 7634 663.1 777.6 8662 1,014.0 1,117,6 1,2752 1,351.7 1.483.7 1,572.7 0.00 1296.6 Enterprise Value less: current outstanding debt Equity Value current shares outstanding Equity Value Per Share -1296.60 271.5 -4.78 FINAL PROJECT INSTRUCTION 1. For the Income Statement, please calculate all the ratios in the black box below Income Statement. 2. For the Balance Sheet, please calculate all the ratios in the black box below the Balance Sheet. 3. For the DCF (Discounted Cash Flow or Free Cash Flow) Analysis, please make your own assumptions based on all the ratios you calculated for Question 1 and 2 and input your assumed numbers in the ASSUMPTION box. Also, please explain the reason why you make such assumptions in the REASON box . 4. Complete the DCF analysis using your given WACC and terminal growth rate and find the fair stock price at the bottom of the template. NIKE, INC.: COST OF CAPITAL Consolidated Income Statements 1995 1996 1997 1998 1999 2000 2001 Year Ended May 31 (In millions except per share data) Revenues Cost of goods sold Gross profit Selling and administrative Operating income Interest expense Other expense, net Restructuring charge, net Income before income taxes Income taxes Net income 4,760.8 2,865.3 1,895.6 1,209.8 685.8 24.2 11.7 6,470.6 3,906.7 2,563.9 1,588.6 975.3 39.5 36.7 9,186.5 5,503.0 3,683.5 2,303.7 1,379.8 52.3 32.3 9,553.1 6,065.5 3,487.6 2,623.8 863.8 60.0 20.9 129.9 653.0 253.4 399.6 8,776.9 5,493.5 3,283.4 2,426.6 856.8 44.1 21.5 45.1 746.1 294.7 451.4 8.995.1 5,403.8 3,591.3 2,606.4 984.9 45.0 23.2 9,488.8 5,784.9 3,703.9 2,689.7 1,014.2 58.7 34.1 (2.5) 649.9 250.2 399.7 899.1 345.9 553.2 1,295.2 499.4 795.8 919.2 340.1 579.1 921.4 331.7 589.7 Diluted carnings per common s! Average shares outstanding (dilu 1.36 294.0 1.88 293.6 2.68 297.0 1.35 296,0 1.57 287.5 2.07 279.8 2.16 273.3 Growth (%) Revenue Operating income Net income PLEASE CALCULATE THE FOLLOWING RATIOS FOR EACH YEAR NA NA NA NA Margins (%) Gross margin Operating margin Net margin Effective tax rate (%)* * The U.S. statutory tax rate was 35%. The state tax varied yearly from 2.5% to 3.5%. NIKE, INC.: COST OF CAPITAL Consolidated Balance Sheets May 31 As of (In millions) 2000 2001 $ $ Assets Current Assets: Cash and equivalents Accounts receivable Inventories Deferred income taxes Prepaid expenses Total current assets Property, plant and equipment, net Identifiable intangible assets and goodwill, net Deferred income taxes and other assets Total assets 2543 1,569.4 1,446.0 1115 2152 3,596.4 304.0 1,621.4 1,424.1 1133 1625 3,6253 1,583.4 410.9 2662 5,856.9 1,618.8 3973 1782 5,819.6 $ $ $ $ Liabilities and shareholders' equity Current Liabilities: Current portion of long-term debt Notes payable Accounts payable Accrued liabilities Income taxes payable Total current liabilities 50.1 9242 543.8 621.9 5.4 8553 432.0 472.1 21.9 1,786.7 2,140.0 Long-term debt Deferred income taxes and other liabilities Redeemable preferred stock 4703 110.3 0.3 435.9 1022 03 Shareholders' equity: Common stock, par Capital in excess of stated value Linearned stock compensation Accumulated other comprehensive income Retained earnings Total shareholders' equity Total liabilities and shareholders' equity 2.8 369.0 (11.7) (111.1) 2,887.0 3,136.0 5.356.9 2.8 459.4 (9.9) (152.1) 3,1943 3,4945 5,819.6 $ $ PLEASE CALCULATE THE FOLLOWING RATIOS FOR EACH YEAR Current assets/Sales (%) Current liabilities/Sales (%) NIKE, INC.: COST OF CAPITAL Discounted Free Cash Flow Analysis 2002 2005 2006 2007 2008 2009 2010 2011 REASONS 6.0 59.0 Revenue growth (%) COGS/Sales (%) S&A/Sales (%) Tax rate(%) Current assets/Sales (%) Current liabilities/Sales (%) Yearly depreciation and capex equal each other. cost of capital (WACC) Terminal value growth rate 7.0 60.0 28.0 38.0 38.0 2003 2004 ASSUMPTIONS 6.5 6.5 60.0 59.5 27.5 38.0 38.0 38.0 38.0 115 115 27.0 6.5 59.5 26.5 38.0 38.0 115 26.0 38.0 38.0 115 6.0 59.0 25.5 38.0 38.0 115 6.0 58.5 25.0 38.0 38.0 115 6.0 58.5 25.0 38.0 38.0 115 6.0 58.0 25.0 38.0 38.0 115 6.0 58.0 25.0 38.0 38.0 11.5 Sensity of equity value to discout rate: Rate Equity Value 8.00% $ 8.50% $ 9.00% $ 9.50% $ 10.00% $ 10.50% $ 11.00% $ 11.17% $ 11.50% $ 12.00% $ 115 12.00% % 3.00% Discounted Cash Flow (In Million Discount N Revenue Cost of goods sold Gross profit Selling and administrative Operating Income Taxes NOPAT Capes net of depreciation NWC Change in NWC Free cash flow (FCF) Terminal Value Total flows Present Value of flows 1 2 3 4 5 6 6 7 8 9 10 10,153.0 10,813.0 11.515.8 12,2643 13,000 2 13,780 2 wwwwww 15,483.4 16,4124 17,3972 6,091.8 6,487.8 6,851.9 7,2973 7,670.1 8,1303 8,545.1 9,057 8 9,5192 10,090,4 4,0612 4,325.2 4,663.9 4,967.1 5,330.1 5,649.9 6,061.9 6,425.6 6,8932 7,306.8 2,842.8 2,973.6 3,1093 3,250.0 3,380.0 3,514.0 3,651.8 3,870.9 4,103.1 4,349.3 1.218.4 1,351.6 1,554.6 1,717,0 1,950.0 2,135.9 2,4102 2,554.8 2,790.1 2,9575 4630 513.6 590.8 652.5 741.0 811.7 915.9 970.8 10602 1123.9 755.4 838.0 963.9 1.064.5 1,209.0 1,3243 1,4943 1,584,0 1,729.9 1,833.7 [] 2690.5 -8.00 763.4 2865.4 174.9 663.1 3051.7 1863 777.6 3250.0 3445.1 3651.8 3870.9 4103.1 43493 198.4 195.0 206.7 219.1 2323 246.2 866.2 1,014.0 1,117,6 1,275.2 1,351.7 1,483.7 46103 261.0 1,572.7 7634 663.1 777.6 8662 1,014.0 1,117,6 1,2752 1,351.7 1.483.7 1,572.7 0.00 1296.6 Enterprise Value less: current outstanding debt Equity Value current shares outstanding Equity Value Per Share -1296.60 271.5 -4.78


